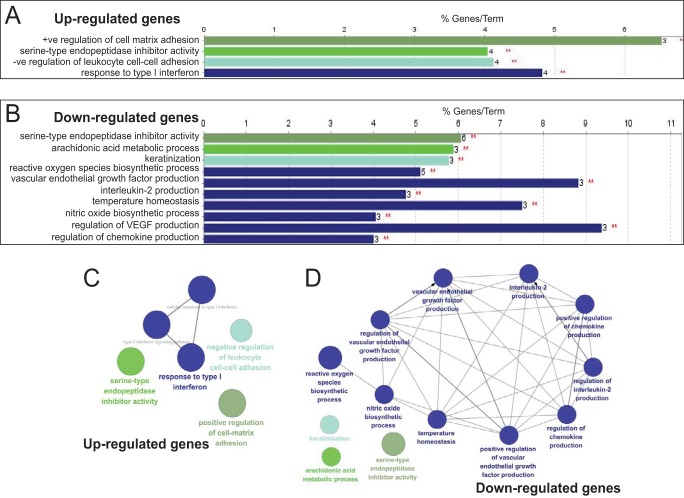
FIG 4.
ClueGO analysis of significantly up- and downregulated genes in HPV16-infected, differentiated NIKS keratinocytes compared to uninfected, differentiated NIKS keratinocytes. We used CluePedia, which extends ClueGO (71) functionality down to genes and visualizes the statistical dependencies (correlation) for markers of interest from the experimental data. (A) Gene ontology (GO) pathway terms specific for upregulated genes. (B) GO pathway terms specific for downregulated genes. The bars represent the numbers of genes associated with the terms on the left. The percentage of altered genes is shown above each bar. Red asterisks refer to significance. (C) Functionally grouped network for upregulated genes. (D) Functionally grouped networks for downregulated genes. Only the label of the most significant term per group is shown. The size of the nodes reflects the degree of enrichment of the terms. The network was automatically laid out using the organic layout algorithm in Cytoscape. Only functional groups represented by their most significant term were visualized in the network. Padj changes of <0.05 were analyzed.

