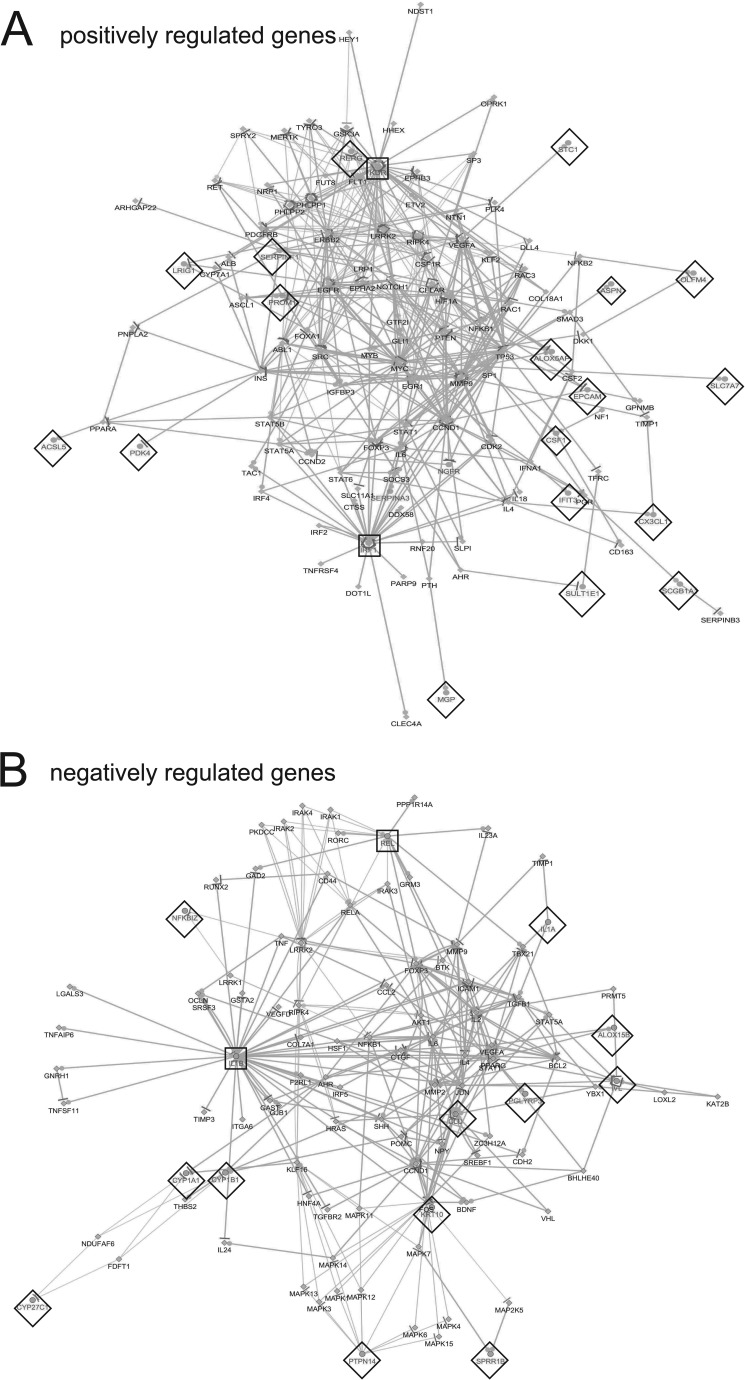
FIG 5.
Interactome of negatively and positively changed genes comparing differentiated NIKS with differentiated NIKS16 cells. Interactome of genes linked through statistical correlation of upregulated (A) and downregulated (B) genes from the experimental data (P < 0.05). Gray lettering and diamonds indicate genes identified in the RNA-Seq data set. Black lettering indicates linked genes. Nodes for genes identified in the data set are indicated by black box outlines. Dots/lines surrounding nodes indicate the numbers of linked pathways. The pathway analysis was produced using CluePedia (http://apps.cytoscape.org/apps/cluepedia).

