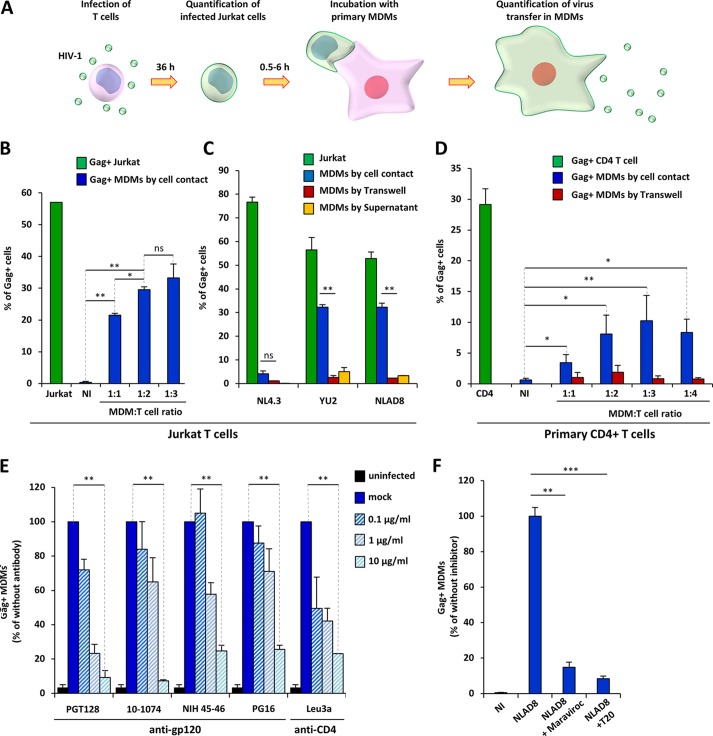
FIG 1.
HIV-1 transfer from infected T cells to macrophages. (A) Experimental protocol. (B) Jurkat cells were infected with the NLAD8 strain, and the percentage of infected cells was evaluated 36 h later by flow cytometry after Gag staining (green bars). Infected Jurkat cells were cocultured for 6 h with MDMs at the indicated cell ratio (1:1, 1:2, or 1:3 MDM/Jurkat cell ratio). After elimination of the Jurkat cells, the percentage of CD11b+/Gag+ MDMs was quantified by flow cytometry (blue bars). As a negative control, noninfected (NI) Jurkat cells were cocultured with MDMs. (C) Jurkat cells were infected with the NL4.3, YU2, or NLAD8 strain, and the percentage of infected cells was evaluated 36 h later by flow cytometry (green bars). The infected Jurkat cells were then cocultured with MDMs directly (blue bars) or through a Transwell membrane (red bars) for 6 h. In parallel, culture supernatants from Jurkat cells collected during the 6-h coculture with MDMs were used to infect autologous MDMs (yellow bars). The percentage of CD11b+/Gag+ MDMs was evaluated by flow cytometry. (D) Purified primary CD4+ T cells were infected with the YU2 strain, and the percentage of infected cells was evaluated 36 h later by flow cytometry (green bar). Infected T cells were then cocultured either directly (blue bars) or through a Transwell membrane (red bars) with autologous MDMs using different cell ratios (1:1, 1:2, 1:3, or 1:4 MDM/T cell ratios) for 6 h. After elimination of T cells, the percentage of CD11b+/Gag+ MDMs was quantified by flow cytometry. As a negative control, noninfected CD4+ T cells were cocultured with MDMs. (E and F) NLAD8-infected Jurkat cells were pretreated with anti-gp120 antibodies or T20, while MDMs were pretreated with anti-CD4 or maraviroc. Infected T cells were cocultured with MDMs for 6 h, and virus transfer to MDMs was quantified as described above. The results are expressed as the percentage of Gag+ MDMs relative to the number of Gag+ MDMs determined without antibodies or inhibitors. The results are the means from 5 independent experiments performed with MDMs from 5 donors. Error bars represent 1 SEM. Statistical significance was determined using a paired Student's t test (ns, not significant [P > 0.05]; *, P < 0.05; **, P < 0.01; ***, P < 0.001).

