
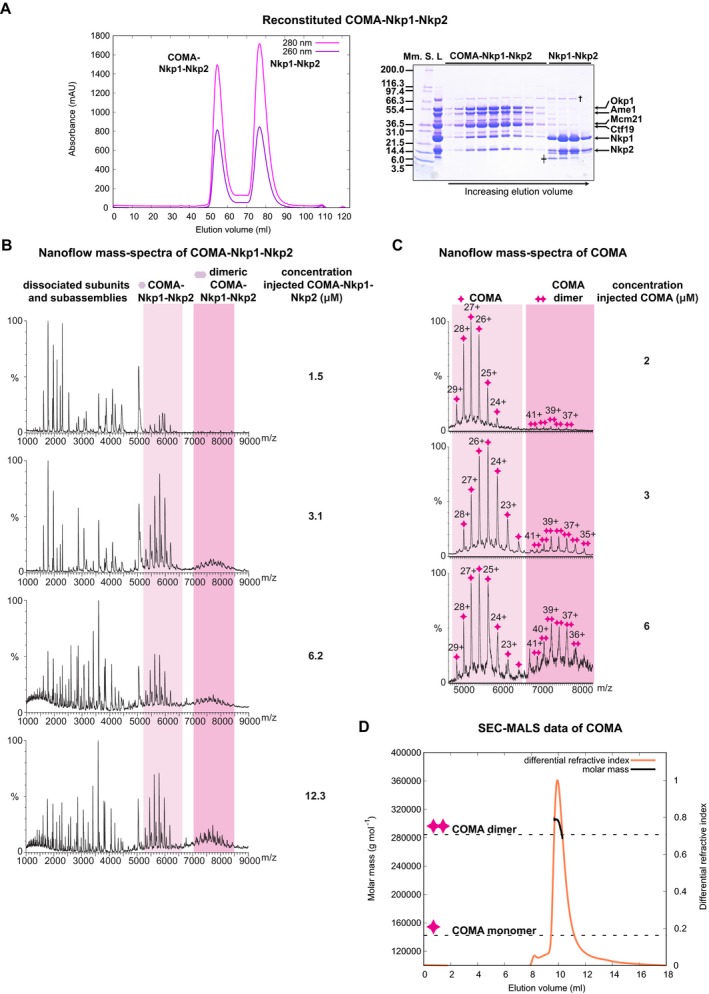
Figure 1. Molecular composition of reconstituted K. lactis COMA‐Nkp1‐Nkp2 or reconstituted K. lactis COMA .
-
A(Left) Representative size‐exclusion chromatography (SEC) chromatogram with absorbance measured at nanometres (nm) 260 or 280 (for this chromatogram and the following ones, absorbances are in units of 1,000−1 (mAU)) of reconstituted K. lactis COMA‐Nkp1‐Nkp2. (Right) Image of Coomassie Blue‐stained SDS–PAGE gel with fractions from principal SEC peaks. Molecular masses of protein standards (Mm. S.) are in kiloDalton (kDa); L: sample loaded on column. †: Escherichia coli DnaK; ╪: proteolysed Nkp1‐Nkp2; Nkp1‐Nkp2 is less prone to spontaneous proteolysis when associated with COMA.
-
B, CNanoflow mass spectra of COMA‐Nkp1‐Nkp2 (B) or COMA (C), acquired with different injected concentrations, showing an increase in COMA‐Nkp1‐Nkp2 dimers or COMA dimers with increasing injectant concentration. For this spectrum, and our other spectra of this type, the charge state of an assigned mass is indicated above its spectral peak.
-
DGraph with measured differential refractive index (relative scale) and molar mass calculated with multi‐angle light scattering (MALS) data of COMA eluting from SEC column (SEC‐MALS). We injected COMA at a concentration of ˜ 43 μM (COMA dimer) on the column. Dashed lines indicate expected molar masses for monomeric COMA or dimeric COMA: 142,337 g/mol or 284,674 g/mol; our experimentally determined molar mass from the principal SEC elution peak: 299,100 g/mol ± 5,683 g/mol (mean ± standard deviation from a single SEC‐MALS experiment); max. dimeric COMA concentration, from refractive index measurement, in principal peak: 2.4 μM.