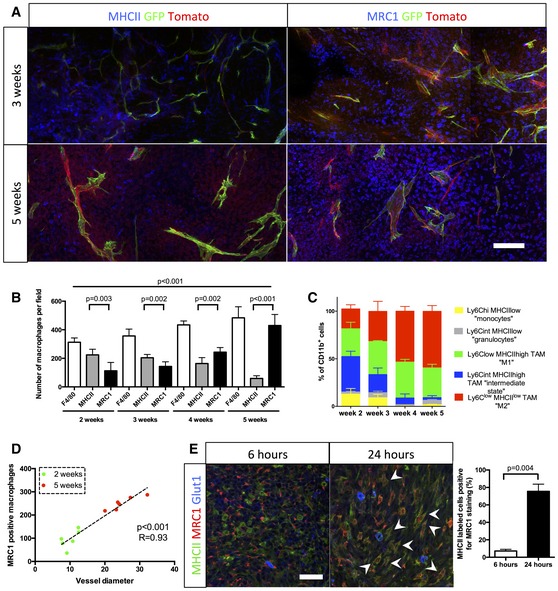
Figure 3. Concomitant macrophage accumulation and in situ switch from M1 to M2 phenotype with blood vessel abnormalities during glioma growth.

- MHCII and MRC1 immunohistochemistry on a section of 3‐ to 5‐week growth glioma implanted in ROSAmT/mG ::Pdgfb‐iCre mouse. M1 macrophages, preferentially located in hypoxic area, are abundant at 3 weeks and their number decreases at 5 weeks. M2 macrophages, preferentially located around blood vessels, are present at a low level at 3 weeks and their number increases at 5 weeks.
- Macrophage quantification during glioma growth (n = 5 mice per group).
- MHCII and MRC1 macrophage population FACs analysis in 2‐, 3‐, 4‐, and 5‐week glioma (subsets in gated CD11b+ cells; n = 3 mice per group).
- Correlation analysis of M2‐like macrophages accumulation (MRC1 positive) with vessel dysmorphia over glioma growth (n = 12 mice).
- MRC1 immunohistochemistry on 3‐week growth glioma in ROSAmTmG ::Pdgfb‐iCre mouse following MHCII‐FITC labeled IV injection at 6 or 24 h (5‐μm depth stack). Note the segregation of MRC1 and MHCII cell labeling at 6 h and the overlapping (examples pointed with arrow heads) of these two markers at 24 h (n = 5 mice per group).
