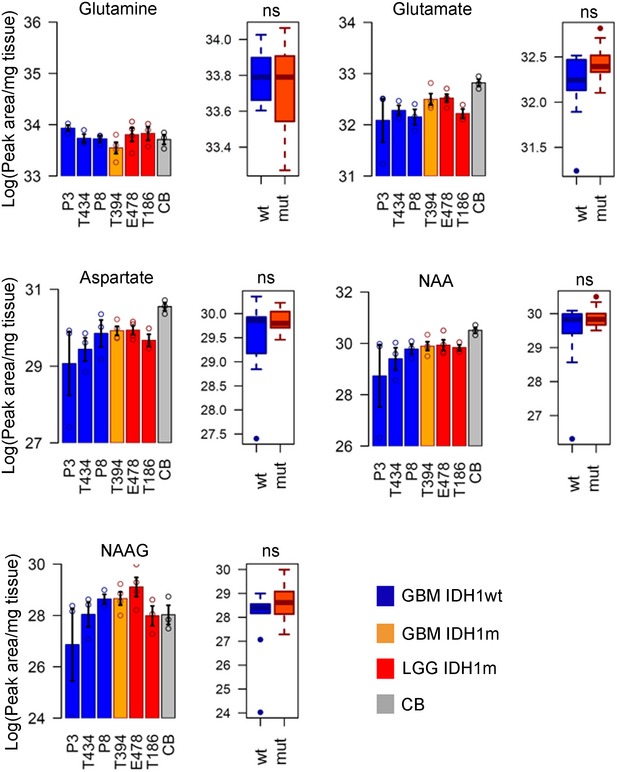
Figure EV3. Quantification of selected metabolites in tissue extracts.

- Quantification of metabolite distribution from independent samples by LC‐MS in six PDX with IDH1wt and IDH1m status and in normal brain (CB) (n = 3/samples/group). Error bars in histograms represent standard error of the mean. Metabolite levels in IDH1wt and IDH1m groups are compared by t‐test. ns: non‐significant. Box limits indicate the 25th and 75th percentiles and center lines show the medians as determined by R software; whiskers represent the extreme low and high observed values, unless those are above 1.5 times interquartile range (IQR) ‐ thereby whiskers are limited to 1.5 IQR. All outlying data points are represented by dots. NAA: N‐acetylaspartic acid; NAAG: N‐acetylaspartylglutamic acid.
