
Figure EV4. Metabolites in clinical glioma tissue extracts.
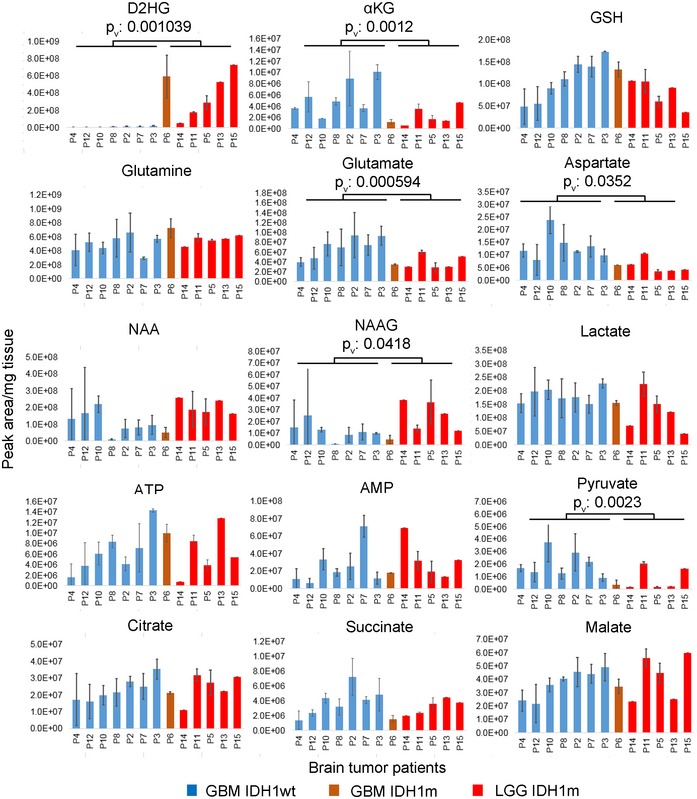
- LC‐MS analysis of selected metabolites in clinical tumor extracts from glioma patients (P2 to P15) with IDH1wt (n = 7) and IDH1m (n = 6) status. IDHwt GBM in blue, IDHm GBM in orange, IDHm LGG in red. Error bars represent standard error of the mean. Results of statistical comparison of IDH1wt and IDH1m groups are indicated, P v: P‐values. NAA: N‐acetylaspartic acid; NAAG: N‐acetylaspartylglutamic acid.