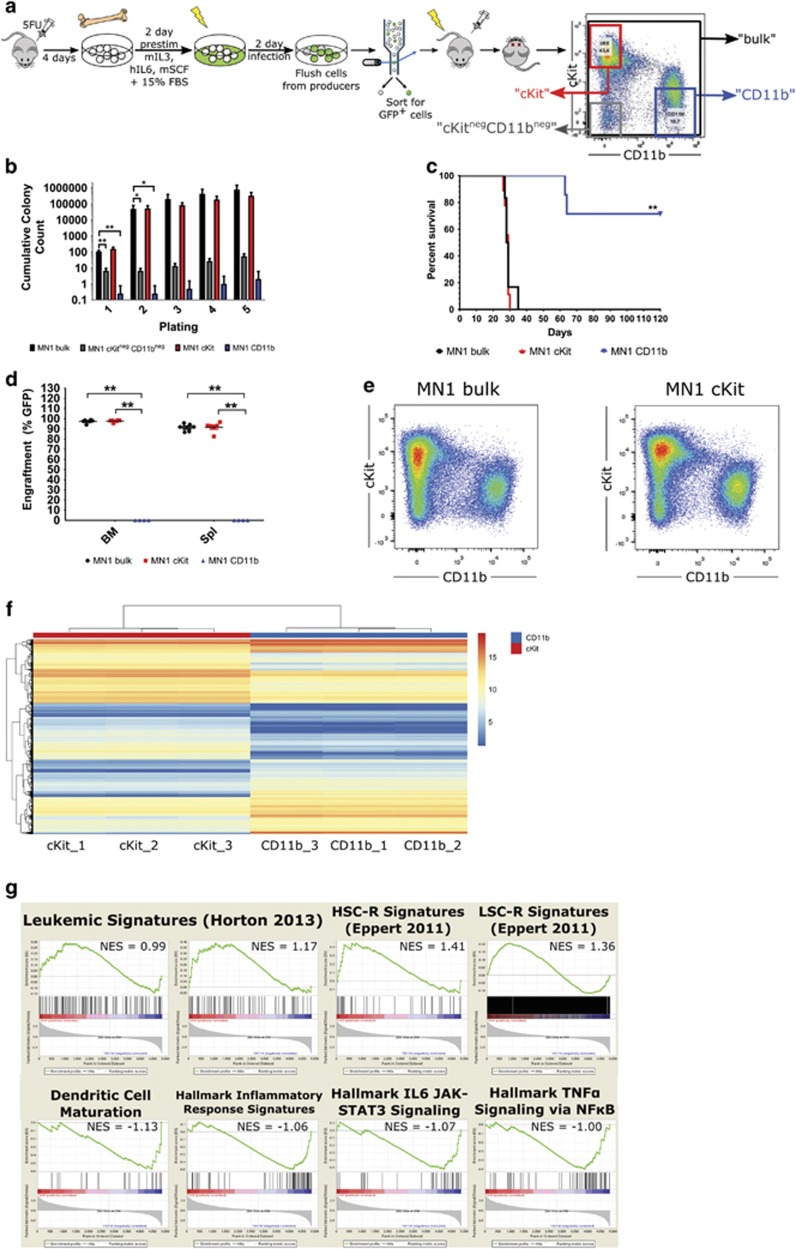
Figure 1.
Primary murine MN1 leukemic cells can be separated into phenotypically distinct populations that are functionally heterogeneous. (a) Experimental design for generation of MN1-transduced 5-FU bone marrow and fractionation of primary bone marrow from moribund mice into three distinct subpopulations based on the cell surface markers cKit and CD11b (cKit+CD11b−, ‘cKit’ cKitneg-midCD11b+, ‘CD11b’ and cKit-CD11b−, ‘cKitnegCD11bneg’) by flow cytometry. (b) Serial replating of sorted MN1 bulk, cKit and CD11b bone marrow cells from moribund MN1 mice, represented as cumulative colony counts. Subpopulations from two independent mice, n=4; error bars represent ±s.e.m.; *P<0.05, **P<0.01 (unpaired t-test versus MN1 bulk). (c) Survival curve of mice transplanted with sorted MN1 bulk, cKit, and CD11b bone marrow subpopulations from leukemic mice transplanted with MN1-transduced cells. n=6 for MN1 bulk, n=8 for cKit and CD11b cells; **P<0.01 (Mantel–Cox). (d) Engraftment in bone marrow of moribund/killed secondary mice transplanted with MN1 bulk, cKit and CD11b cells. n=6 for MN1 bulk, n=8 for cKit and n=4 for CD11b. Unpaired two-tailed t-test in MN1 bulk versus cKit/CD11b. Error bars represent ±s.e.m.; **P<=0.05. (e) Representative flow cytometric analysis of cKit and CD11b cell surface markers on GFP+ bone marrow from moribund mice transplanted with MN1 bulk or cKit cells. (f) Heatmap of unsupervised hierarchical clustering of the top 500 differentially expressed annotated gene between cKit and CD11b cells. From three mice representing two independent transductions, unpaired t-test, fold change ⩾1.5, corrected P-value<0.05 (Benjamini–Hochberg correction). (g) GSEA of differentially expressed annotated gene sets in cKit versus CD11b cells. NES, normalised enrichment score; FDR, false discovery rate and P-value calculated as previously referenced.17

