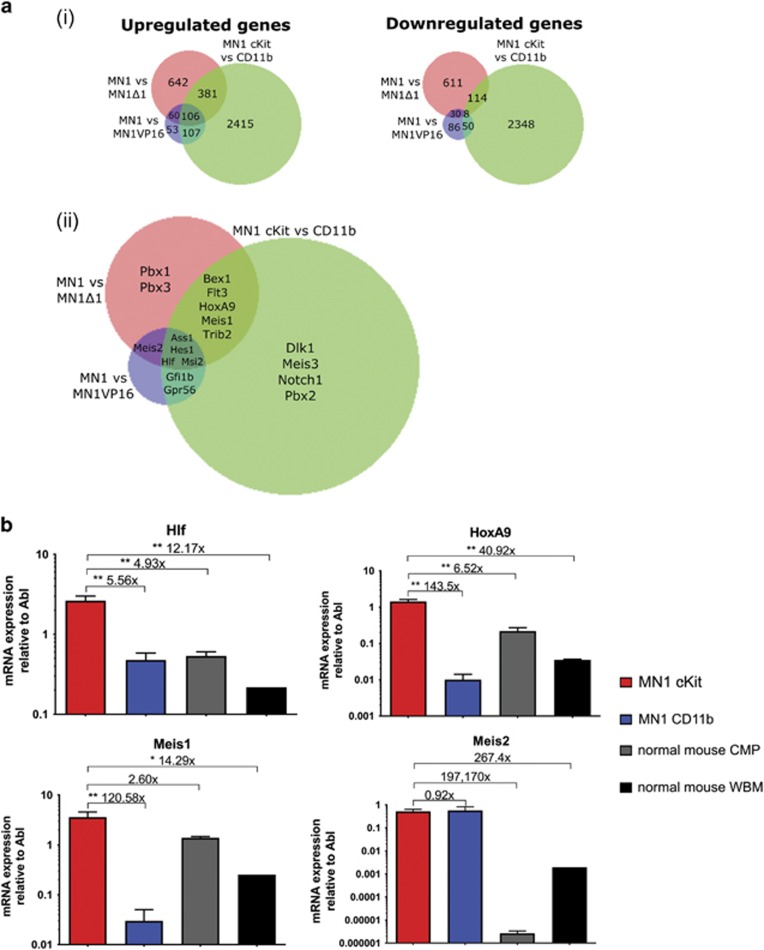
Figure 2.
Comparisons of gene expression analysis between MN1 populations with varying leukemic potencies. (a) (i) Graphical representation of overlapping differentially expressed up- and downregulated genes between MN1 versus MN1Δ1, MN1 versus MN1VP16 and MN1 cKit versus CD11b data sets. (ii) Comparisons of MN1 gene expression data sets representing models of varying leukemic potencies where shortlisted genes are differentially expressed. (b) Absolute gene expression of candidate genes functionally assessed relative to Abl in cKit, CD11b, CMP and whole bone marrow (WBM) cells by qRT–PCR. n=3 from four mice transplanted with cells from three independent transductions, one-sided ANOVA; error bars represent ±s.e.m.; *P<0.05, **P<0.01.

