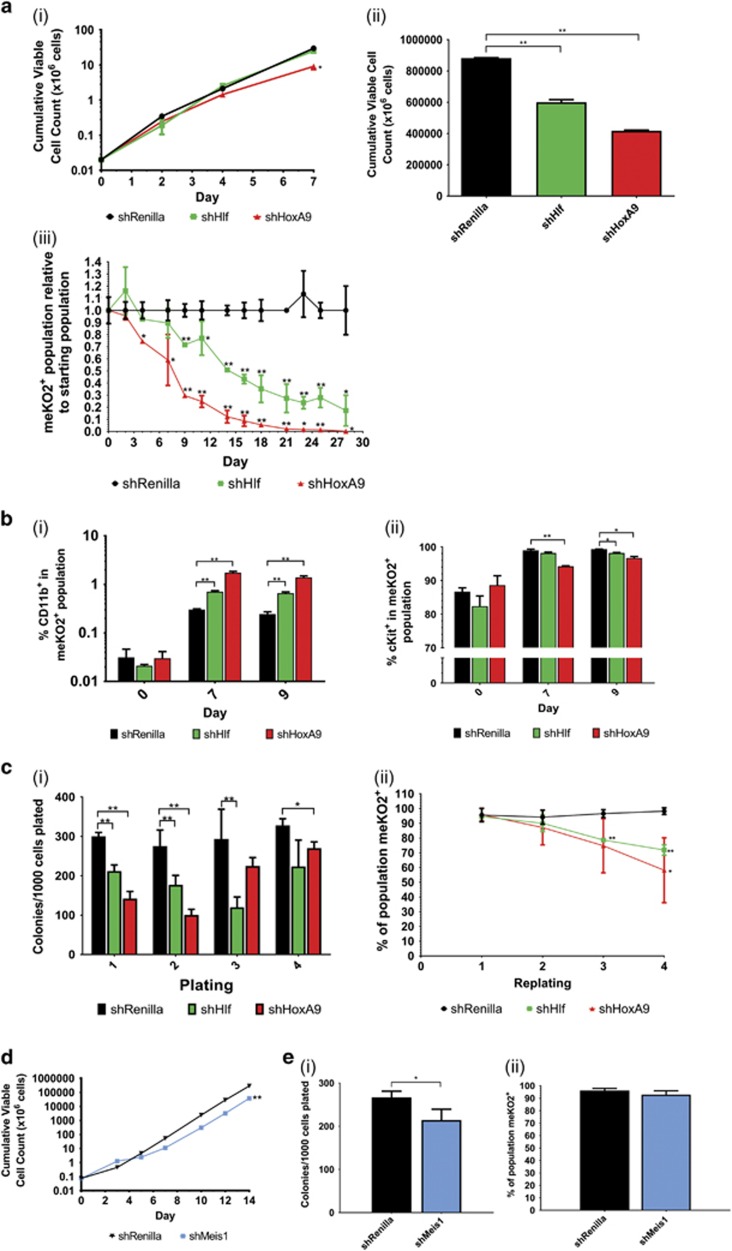
Figure 3.
Investigation of the functional relevance of Hoxa9, Hlf and Meis1 on MN1 leukemic properties. (a) (i) Growth kinetics of shRenilla-, shHlf- and shHoxa9-transduced MN1 cell lines after flow cytometric sorting. (ii) Cumulative viable cell count of shRenilla-, shHlf- and shHoxa9-transduced MN1 cell lines 14 days after flow cytometric sorting. n=3 from three independent experiments, multiple two-tailed t-test in shRenilla versus shRNA; error bars represent ±s.d.; *P<0.05, **P<0.01. (iii) Competitive growth assay containing mixed populations of 50% sorted untransduced MN1 cells and 50% sorted shRenilla-, shHlf-, or shHoxa9-transduced (meKO2+) MN1 cells, visualised as meKO2+ proportion relative to starting population. n=3 from three independent experiments, multiple two-tailed t-test in shRenilla versus shRNA; error bars represent ±s.d.; *P<0.05, **P<0.01. (b) (i) CD11b expression of shRenilla-, shHlf- and shHoxa9-transduced MN1 cell lines 0, 7 and 9 days after flow cytometric sorting. (ii) cKit expression in shRenilla-, shHlf- and shHoxa9-transduced MN1 cells 0, 7 and 9 days after flow cytometric sorting. Sorted meKO2+ cells; n=3 from four independent experiments, multiple two-tailed t-test in shRenilla versus shRNA; error bars represent ±s.d.; *P<0.05, **P<0.01. (c) (i) Serial colony replating of shRenilla- and shHlf- and shHoxa9-transduced MN1 cell lines post-sort, represented per 1000 cells plated. (ii) Percentage of meKO2+ expressing cells from colony-forming cell assay-derived colonies of shRNA-transduced MN1 cells. Sorted meKO2+ cells, n=3 from four independent experiments, multiple two-tailed t-test; error bars represent ±s.d.; *P<0.05, **P<0.01. (d) Growth kinetics of shRenilla-, shMeis1-transduced MN1 cell line after flow cytometric sorting. (e) (i) CFU assay of shRenilla- and shMeis1-transduced MN1 cell lines 10 days after flow cytometric sorting. (ii) Percentage of meKO2+ expression of cells comprising colonies of transduced MN1 cells in CFU assay. Sorted meKO2+ cells; n=4 from three independent experiments, represented per 1000 cells plated; multiple two-tailed t-test in shRenilla versus shRNA. Error bars represent ±s.e.m.; *P<0.05, **P<0.01.

