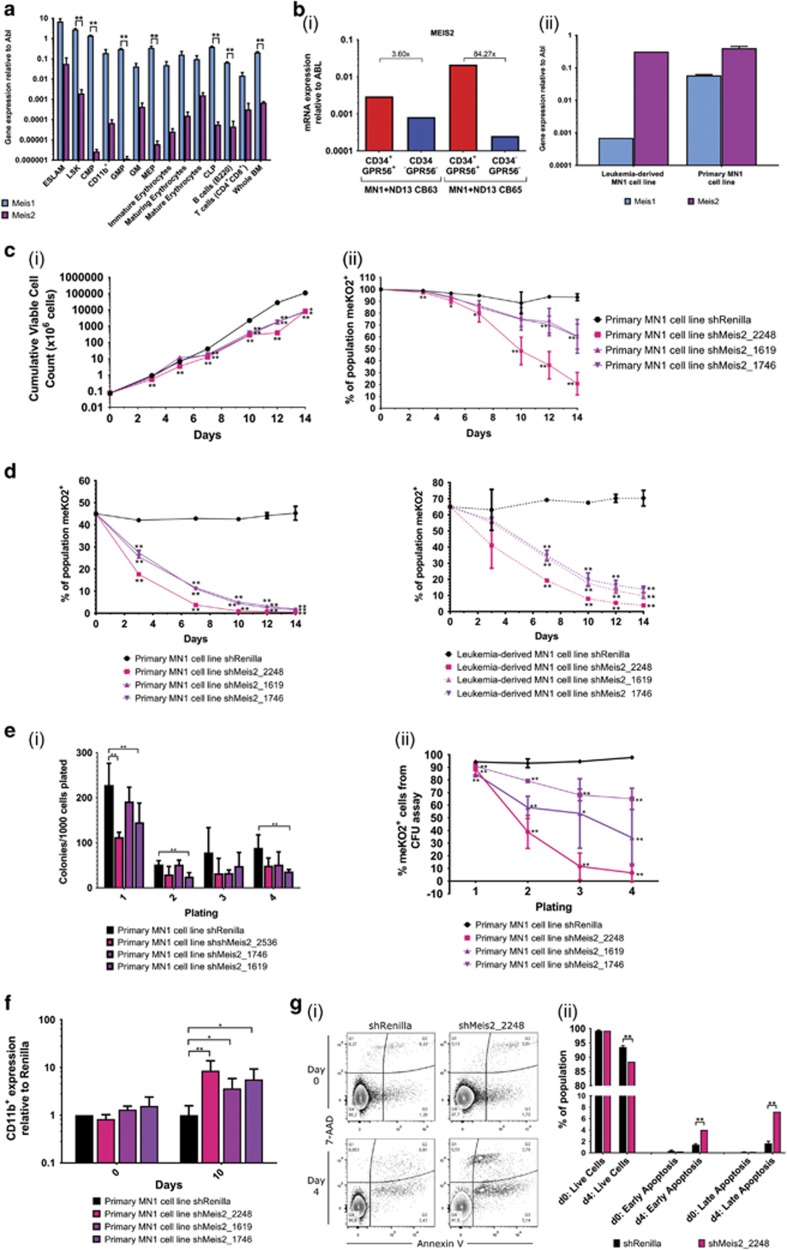
Figure 4.
Knockdown of Meis2 impairs the functional leukemic properties of MN1 cells. (a) Gene expression of Meis1 and Meis2 relative to Abl by qRT–PCR in murine hematopoietic compartments. n=3 from three independent mice, two-tailed t-test; error bars represent ±s.e.m.; **P<0.01. (b) (i) Gene expression of MEIS2 relative to ABL by qRT–PCR in CD34+GPR56+ compared to CD34−GPR56- fraction of two human AML cord blood models generated through overexpression of NUP98-HOXD13 fusion and MN1 (ND13+MN1). n=2 from two independent cell lines. (ii) Gene expression of Meis1 and Meis2 relative to Abl by qRT–PCR in leukemia-derived and primary MN1 cell lines. n=3 from each cell line, unpaired two-tailed t-test; error bars represent ±s.d. (c) (i) Growth kinetics of shRenilla-, shMeis2-transduced MN1 cell line after lentiviral transduction. (ii) Kinetics of meKO2+ expression of shRenilla- and shMeis2-transduced MN1 cells after flow cytometric sorting. (d) Competitive growth assay containing mixed populations of 50% sorted untransduced MN1 cells and 50% sorted shRenilla- or shMeis2-transduced (meKO2+) primary and leukemia-derived MN1 cell lines. Sorted meKO2+ MN1 cells; n=3 from three (shMeis2_2248) or two (shMeis2_1619 and shMeis2_1746) independent experiments, multiple two-tailed t-test in shRenilla versus shRNA; error bars represent ±s.e.m.; *P<0.05, **P<0.01. (e) (i) Serial colony replating of shRenilla- and shMeis2-transduced sorted MN1 cell line, represented per 1000 cells plated. (ii) Percentage of meKO2+ expressing cells comprising colonies of transduced MN1 cells in CFU assay. Sorted meKO2+ cells, n=4 from two independent experiments, multiple two-tailed t-test; error bars represent ±s.e.m.; *P<0.05, **P<0.01. (f) (i) CD11b+ expression of shRenilla- and shMeis2-transduced leukemia-derived MN1 cell lines 10 days after flow cytometric sorting. Sorted meKO2+ MN1 cells; n=3 from three (shMeis2_2248) or two (shMeis2_1619 and shMeis2_1746) independent experiments; error bars represent ±s.e.m.; *P<0.05, **P<0.01. (g) (i) Representative flow cytometric analysis of apoptosis (Annexin V/7-AAD staining) of shRenillla- and shMeis2-transduced MN1 cells at 0 and 4 days post-sort. (ii) Annexin V apoptosis assay summary of shRenilla- and shMeis2-transduced live, early apoptotic and late apoptotic MN1 cells at 0 and 4 days post-sort from three independent experiments in triplicate. Multiple two-tailed t-test in shRenilla versus shMeis2_2248. Error bars represent ±s.e.m.; **P<0.01.

