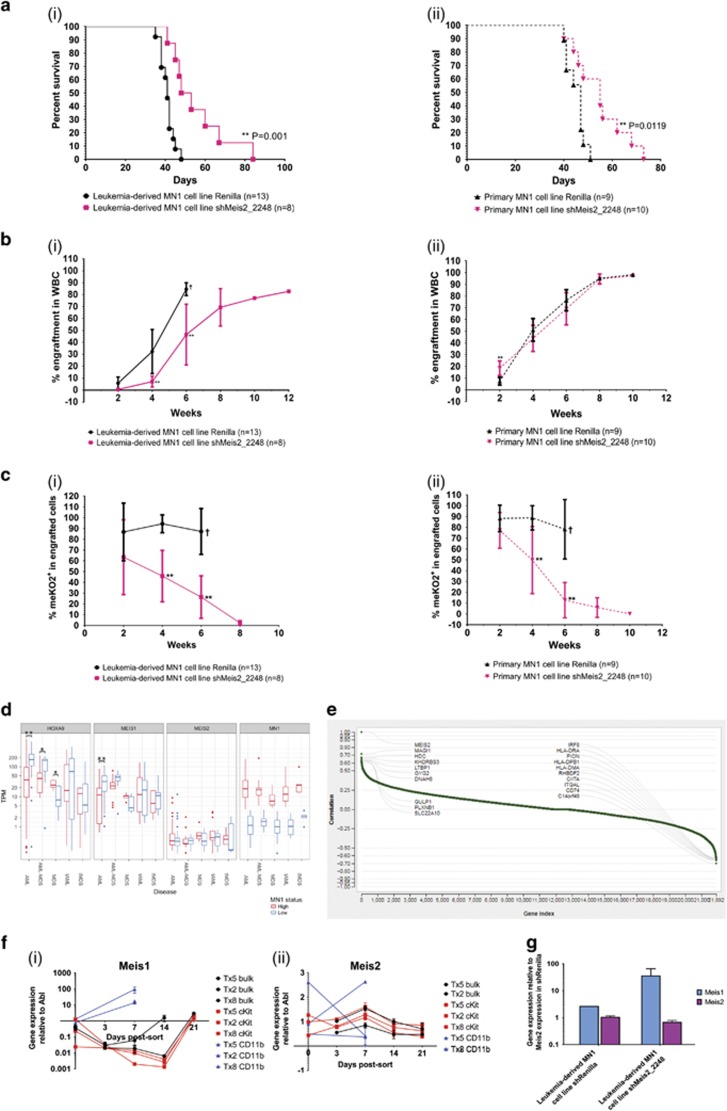
Figure 5.
Knockdown of Meis2 increases latency and delays engraftment kinetics of MN1 cells due to loss of shMeis2-transduced cells. (a) Survival curve of mice transplanted with shRenilla- and shMeis2-transduced (i) leukemia-derived and (ii) primary MN1 cell lines. Leukemia-derived: n=13 for shRenilla, n=8 for shMeis2; primary: n=9 for shRenilla, n=10 for shMeis2; Mantel–Cox test. (b) Engraftment kinetics of mice transplanted with shRenilla- and shMeis2-transduced (i) leukemia-derived and (ii) primary MN1 cell lines, as determined by bi-weekly peripheral blood analysis. Leukemia-derived: n=13 for shRenilla, n=8 for shMeis2; primary: n=9 for shRenilla, n=10 for shMeis2; multiple two-tailed t-test in shRenilla versus shMeis2; error bars represent ±s.d.; † indicates all mice were killed after this timepoint due to disease, *P<0.05, **P<0.01. (c) Proportion of meKO2+ cells within engrafted cells of mice transplanted with shRenilla- and shMeis2-transduced (i) leukemia-derived and (ii) primary MN1 cell lines, as determined by bi-weekly peripheral blood analysis. Leukemia-derived: n=13 for shRenilla, n=8 for shMeis2; primary: n=9 for shRenilla, n=10 for shMeis2. Multiple two-tailed t-test in shRenilla versus shMeis2. Error bars represent ±s.d.; † indicates all mice were killed after this timepoint due to disease, *P<0.05, **P<0.01. (d) Distribution of HOXA9, MEIS1, MEIS2 and MN1 expression in patients with AML or MDS, categorised by MN1 expression level. *P<0.05, **P<0.01 (two-sided Welch’s two-sample t-test). (e) Waterfall plot visualising single gene correlation of MEIS2 and top 10 positively and negatively correlated genes based on RNA-Seq from Leucegene normal karyotype AML data set. (f) (i) Meis1 and (ii) Meis2 gene expression kinetics of primary MN1 mouse bone marrow cells sorted into MN1 bulk, cKit and CD11b subpopulations and cultured in vitro. n=3 from three independent experiments. Error bars represent ±s.d. (g) Relative gene expression of Meis1 and Meis2 6 days post-transduction in shRenilla- or shMeis2-transduced MN1 cells. Sorted meKO2+ cells, n=3, unpaired t-test. Error bars represent ±s.d.; *P<0.05, **P<0.01.

