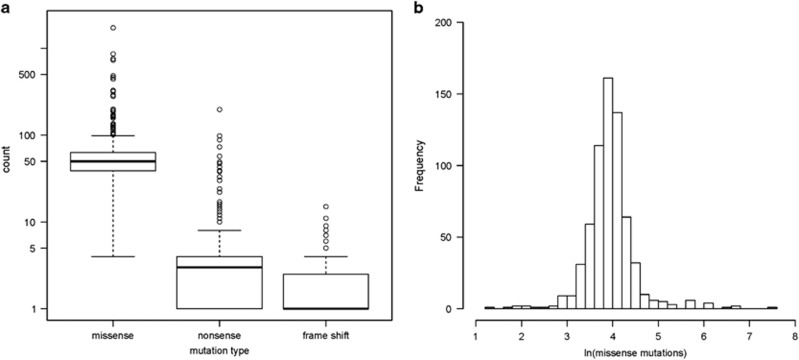
Figure 1.
Patient-specific mutational load. (a) Distribution of individual patient missense, nonsense, and frameshift somatic mutation counts for the 664 patient cohort. Box represents 25–75% of patients. Bolded line marks the median mutation count. (b) Histogram of natural log-transformed somatic missense mutation count shows log transformation normalizes the distribution of missense mutation frequency in patients.

