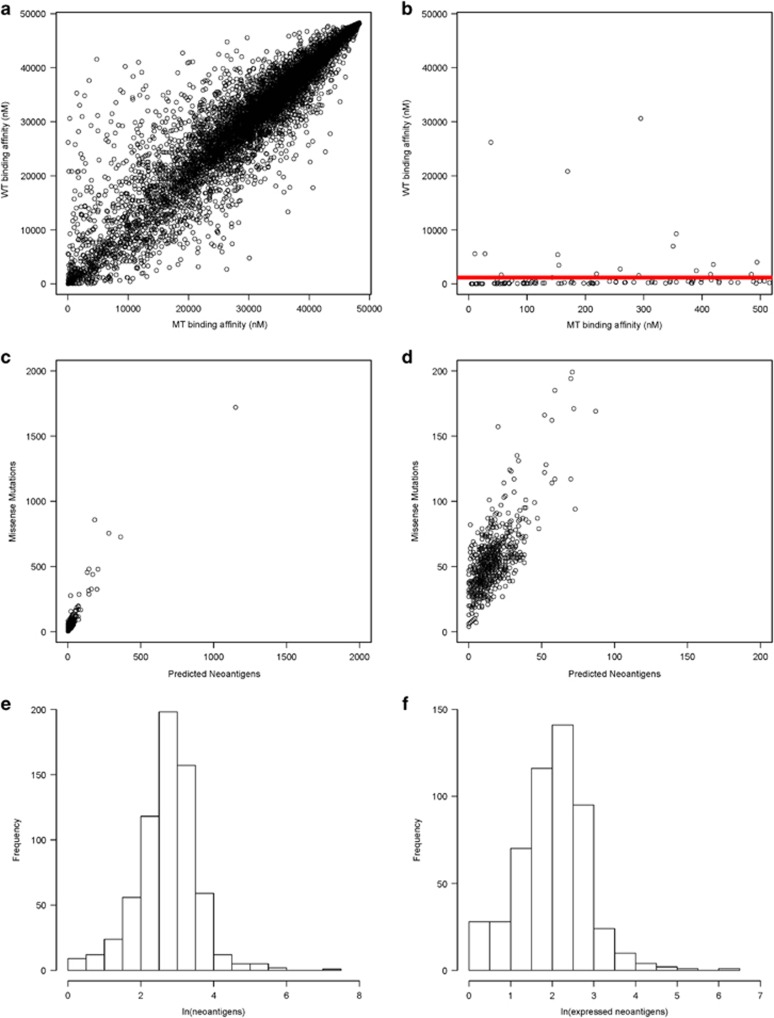
Figure 2.
Correlation between somatic missense mutation load and predicted neoantigen load. (a) Example of predicted neoantigen-binding affinities relative to wild-type binding affinities in a patient with near average mutation load (missense mutation load=64). Predicted binding affinity (IC50) for every 8/9/10-mer peptide containing somatic missense mutation compared to the predicted binding affinity of the consensus non-mutated peptide. (b) Predicted neoantigen-binding affinities relative to wild-type binding affinities for the same patient after limiting the x axis to 500 nM. The red line indicates the accepted cutoff for potential neoantigens. Points above the red line are those with mutant peptide-binding affinity IC50<500 nM and wild-type peptide-binding affinity IC50>500 nM, and are considered potential neoantigens. (c) Missense mutation load vs number of potential neoantigens with predicted binding affinity IC50<500 nM and consensus wild-type-binding affinity IC50>500 nM for all multiple myeloma test cohort patients (linear regression analysis R2=0.862). (d) Magnified view of (c) using decreased x- and y axis limits to show missense mutation vs predicted neoantigen load in test cohort. (e) Histogram of natural log-transformed predicted neoantigen count (mutant peptide-binding affinity IC50<500 nM and wild-type peptide-binding affinity IC50>500 nM) shows log transformation normalizes the distribution of predicted neoantigen frequency in patients. (f) Histogram of natural log-transformed predicted expressed neoantigen count (mutant peptide-binding affinity IC50<500 nM, wild-type peptide-binding affinity IC50>500 nM, RNAseq counts ⩾1) shows log transformation normalizes the distribution of predicted expressed neoantigen frequency in patients.

