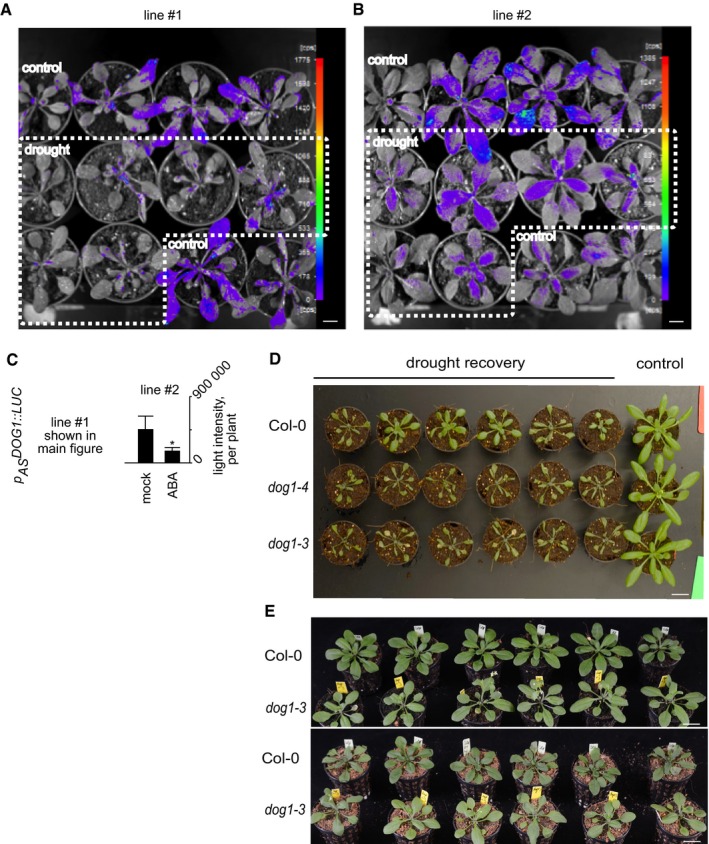
Figure EV3. Analysis of drought responses in pASDOG 1::LUC transgenic plants and dog1 mutants.

-
A, BDownregulation of antisense transcription by drought of two independent p AS DOG1::LUC lines. Scale bar, 1 cm.
-
CGraph represents quantification of light intensity per plant. Error bars represent standard deviation. *t‐test‐derived P‐value < 0.05, n = 12 for each of two lines.
-
DDrought susceptibility of dog1‐3 and dog1‐4 mutants in comparison with Col‐0 (WT) plants after 5 days of treatment, independent repeat. Scale bar, 2 cm.
-
EGrowth phenotype of Col‐0 (WT) and dog1‐3 mutant plants used for RT–qPCR analysis of DOG1 sense/antisense and marker genes at 3 days of drought. Scale bar, 2 cm.
