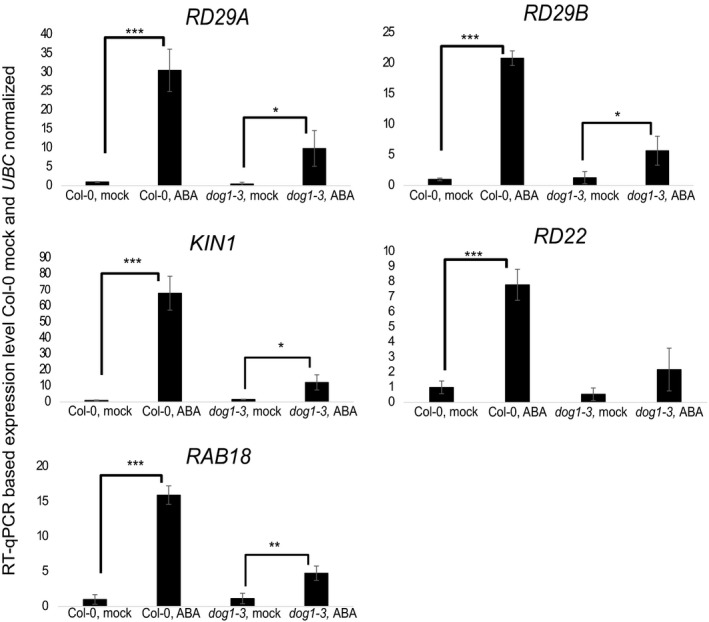
Figure EV4. RT–qPCR analysis of selected marker gene expression in Col‐0 (WT) and dog1‐3 mutant after 10 h of 100 μM ABA spray‐inoculation.

Error bars represent standard deviation. *, ** and *** represent t‐test P‐values of < 0.05, < 0.01 and < 0.001, respectively, n = 4.
