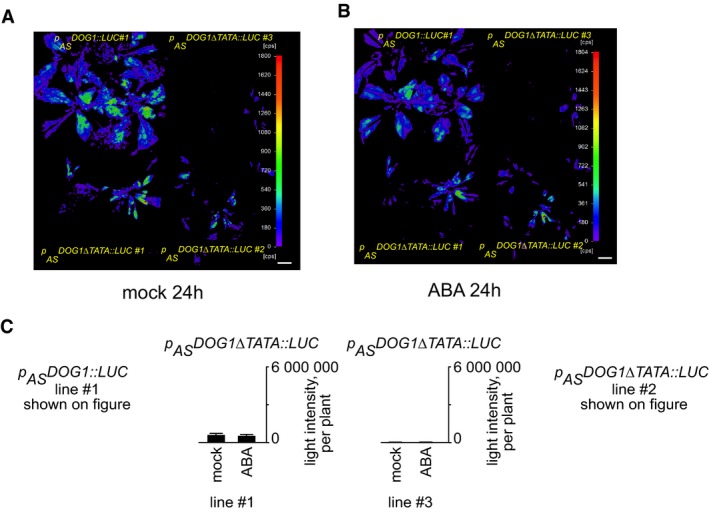
Figure EV5. Bioluminescence analysis of transgenic lines expressing pASDOG 1::LUC and pASDOG 1::LUCΔTATA lines after 24 h.

-
A, BPlants were mock treated and imagined after 24 h, subsequently sprayed with 100 mM ABA and imaged 24 h later. Scale bar, 2 cm.
-
CQuantification of LUC pictures as relative light intensity per plant. Error bars represent standard deviation, n = 8 for each of three lines.
