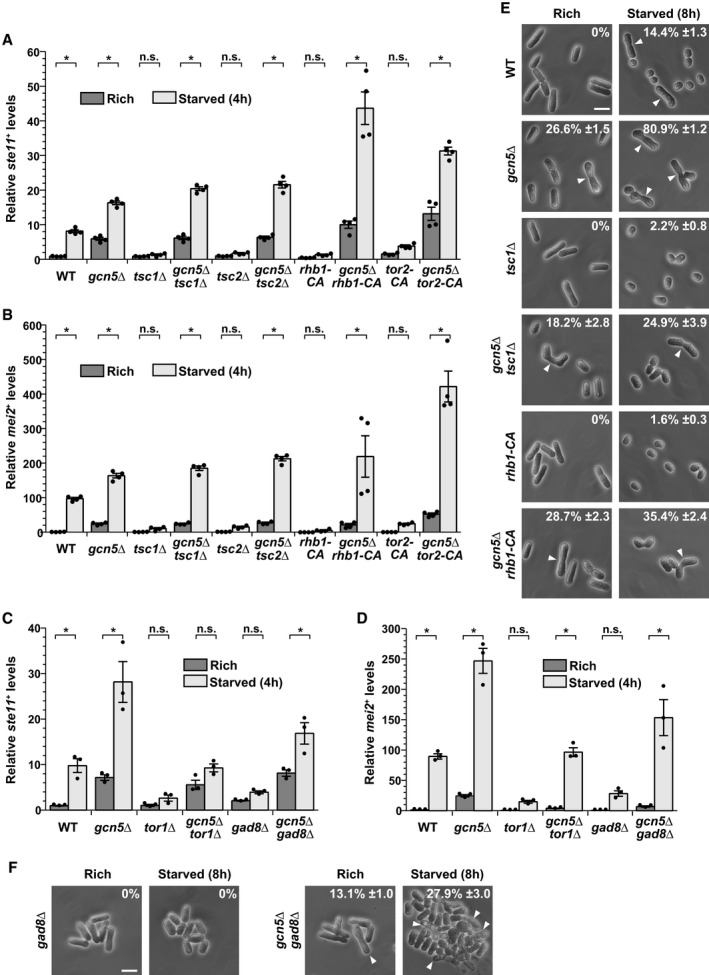
Expression of
ste11
+ (A, C) and
mei2
+ (B, D) using quantitative RT–PCR of RNA extracted from cells grown either in nutrient rich medium (dark gray) or shifted for 4 h to starvation medium (light gray). Cells of the following genotypes were analyzed: wild‐type isogenic controls (WT),
gcn5Δ,
tsc1Δ,
gcn5Δ
tsc1Δ,
tsc2Δ,
gcn5Δ
tsc2Δ,
rhb1‐DA4—a constitutively active (CA)
rhb1 mutant
34,
gcn5Δ
rhb1‐DA4,
tor2‐L1310P—a CA
tor2 mutant
33,
gcn5Δ
tor2‐L1310P,
tor1Δ,
gcn5Δ
tor1Δ,
gad8Δ, and
gcn5Δ
gad8Δ.
act1
+ served as a control for normalization across samples. Values from a WT strain grown in rich medium were set at 1 to allow comparisons across culture conditions and mutant strains. Each column represents the mean value of 4 (A, B) or 3 (C, D) independent experiments, overlaid with individual data points and error bars showing the standard error of the mean (SEM). Statistical significance was determined by two‐way ANOVA followed by Bonferroni's multiple comparison tests (
n = 4 for A, B;
n = 3 for C, D);
*P ≤ 0.01.

