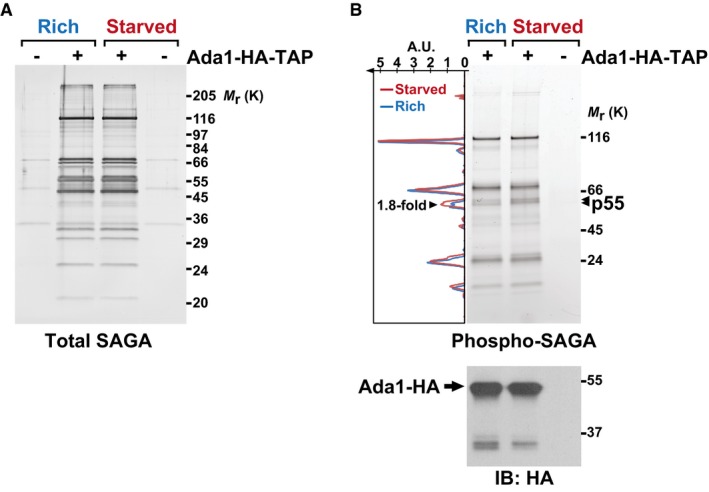
A, B4–20% gradient SDS–polyacrylamide gel electrophoresis analysis of SAGA purified from cells grown either in rich medium (R) or starved for 45 min (S). SAGA was purified using endogenously TAP‐tagged Ada1. A fraction of each eluate was loaded and either stained with silver, to detect all proteins (A), or with Pro‐Q® Diamond, which stains phosphorylated proteins (B). A strain without any TAP tag is shown as a negative control for the purification. The graph to the left of the gel in (B) shows the fluorescence intensity of the phospho‐specific stain, which was quantified along the left lane in blue (rich) and the middle lane in red (starved), using ImageJ. The area of one peak, which corresponds to the bands marked with arrowheads and was coined p55, is 1.8‐fold larger in SAGA purified from starved cells, as compared to rich conditions. Below is an anti‐HA immunoblot (IB) of each eluate, to reveal the amount of Ada1‐HA bait recovered. Shown are gels that are representative of three independent experiments. A.U., arbitrary units.

