-
A
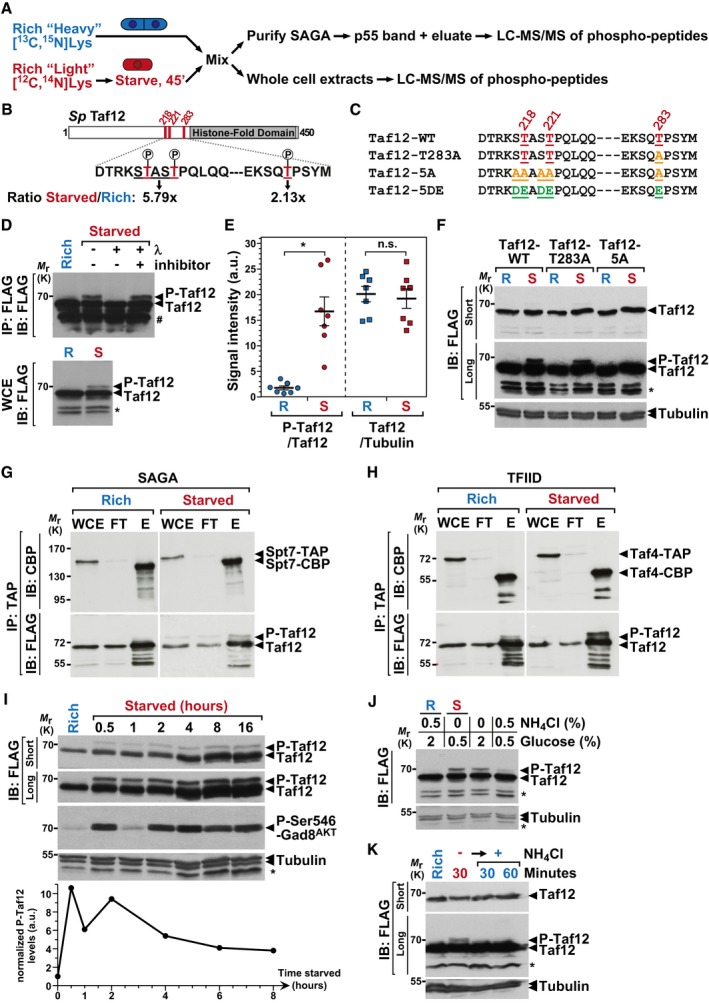
Overview of the quantitative proteomic approaches used to identify differentially phosphorylated peptides, either in crude extracts or in SAGA purifications. Cells were metabolically labeled using a SILAC procedure and grown either in rich medium or shifted to nutrient starvation conditions. Several independent experiments were carried out with forward and reverse labeling schemes (see
Materials and Methods for details).
-
B
Schematic view of the
S. pombe (
Sp) Taf12 protein sequence, including, in red, the three differentially phosphorylated Thr, at positions 218, 221, and 283 and, in gray, the histone‐fold domain. Shown below are the starved‐to‐rich SILAC ratios of the signal intensities observed for the Thr218‐Thr221 peptide (
Appendix Fig S3) and for the Thr283 peptide (
Appendix Fig S4).
-
C
Summary of the different taf12
+ point mutants that were constructed and analyzed.
-
D
FLAG‐tagged Taf12 was purified from cells grown in rich medium (R) or shifted for 45 min to starvation medium (S). Anti‐FLAG immuno‐precipitations (IP) were incubated with and without λ‐phosphatase or its inhibitor and immunoblotted (IB), together with 1% of whole cell extracts (WCE), using an anti‐FLAG antibody.
-
E
Phospho‐Taf12 (P‐Taf12), total Taf12, and tubulin levels were quantified from cells grown in rich medium (R) or starved for 45 min (S). P‐Taf12 levels were normalized to those of total Taf12, while total Taf12 levels were normalized to those of tubulin. Data points were individually plotted on the graph and overlaid with the mean and SEM. Signal intensities were quantified from IBs of seven independent experiments. Statistical significance was determined using a t‐test (n = 7, unpaired, two‐tailed); *P ≤ 0.01.
-
F
P‐Taf12 and total Taf12 were followed in WT, taf12‐T283A and taf12‐5A mutants, grown in rich medium (R) or starved for 45 min (S).
-
G, H
SAGA and TFIID were tandem affinity‐purified using endogenously TAP‐tagged Spt7 (G) or Taf4 (H), from strains containing FLAG‐tagged Taf12, grown in rich medium or starved for 45 min. TAP‐tagged Spt7 and Taf4 were eluted using the TEV protease, releasing a shorter form of each bait (Spt7‐CBP or Taf4‐CBP). Eluates were loaded and immunoblotted (IB) using anti‐FLAG or anti‐CBP antibodies, together with 1% of either whole cell extracts (WCE) or IgG‐Sepharose flow‐through (FT). Shown are IBs that are representative of two independent experiments.
-
I
P‐Taf12, total Taf12, and Ser546‐phosphorylated Gad8AKT were followed in WT cells, grown in rich conditions or over a time‐course after a shift to starvation medium. Gad8AKT phosphorylation at Ser546 is a proxy of TORC2 activity in S. pombe.
-
J
P‐Taf12 and total Taf12 were followed in WT cells, grown in rich conditions or shifted to different starvation media for 30 min. These include both the removal of the nitrogen source, ammonium chloride (NH4Cl), and the reduction in the carbon source, glucose, from a concentration of 2–0.5%. Alternatively, cells were either only deprived of NH4Cl or only exposed to reduced glucose levels (2–0.5%).
-
K
P‐Taf12 and total Taf12 were followed in WT cells, grown in rich conditions or deprived of NH4Cl for 1 h. Then, NH4Cl was added back to the medium for 30 or 60 min.
Data information: Shown are IBs that are representative of at least three independent experiments. The number sign (#) symbol identifies antibody heavy chains and the star (*) symbol labels an unspecific band detected by the anti‐FLAG antibody in
. Both short and long exposures of the FLAG IBs are shown to detect total Taf12 and P‐Taf12, respectively, within the linear range of the chemiluminescence signal. Anti‐tubulin IBs are shown as controls for loading between samples.

