-
A
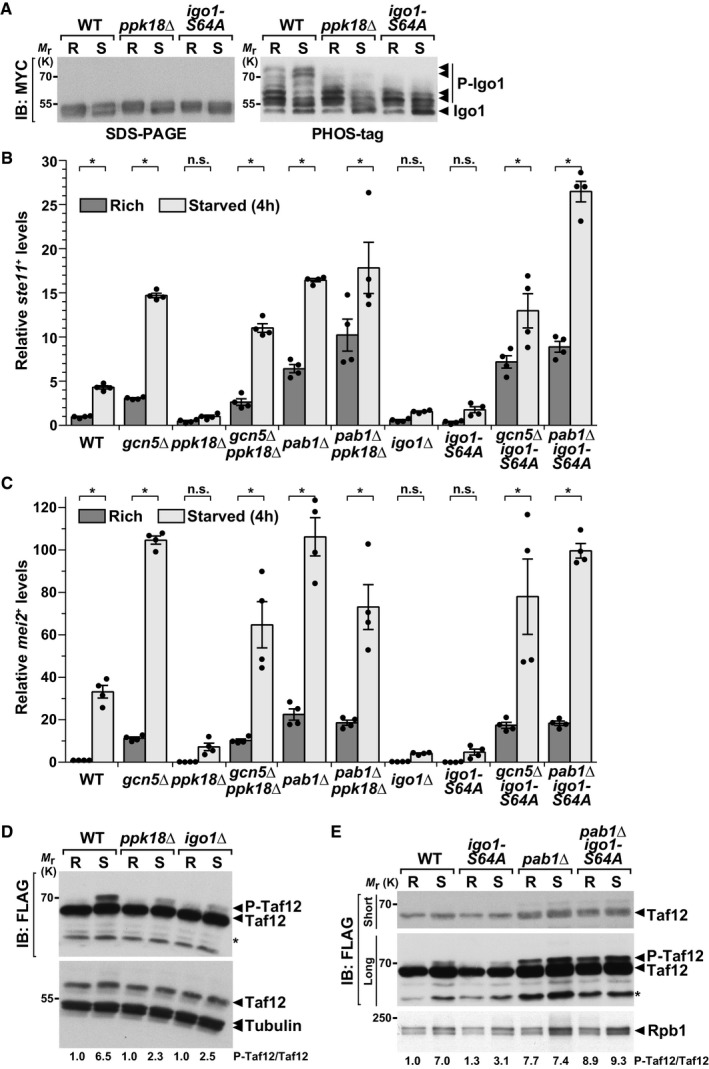
Igo1 phosphorylation (P‐Igo1) was followed by anti‐MYC IB of protein extracts from WT, ppk18Δ, and igo1‐S64A strains, grown in rich conditions (R) or starved for 45 min (S). Igo1 migration was analyzed by electrophoresis of both a 12% SDS–polyacrylamide gel containing the Phos‐tag™ molecule (right panel) and a standard 10% SDS–polyacrylamide gel (left panel). Arrowheads indicate the various phosphorylated isoforms of Igo1‐MYC in each strain and condition. Shown is an IB representative of two independent experiments.
-
B, C
Expression of ste11
+ (C) and mei2
+ (D) using quantitative RT–PCR of RNA extracted from cells grown either in rich medium (dark gray) or starved for 4 h (light gray). Cells of the following genotypes were analyzed: wild‐type isogenic controls (WT), gcn5Δ, ppk18Δ, gcn5Δ ppk18Δ, pab1Δ, pab1Δ ppk18Δ, igo1Δ, igo1‐S64A, gcn5Δ igo1‐S64A, and pab1Δ igo1‐S64A. act1
+ served as a control for normalization across samples. Values from a WT strain grown in rich medium were set at 1 to allow comparisons across culture conditions and mutant strains. Each column represents the mean value of four independent experiments, overlaid with individual data points and SEM. Statistical significance was determined by two‐way ANOVA followed by Bonferroni's multiple comparison tests (n = 4); *P ≤ 0.01.
-
D
P‐Taf12 was followed by anti‐FLAG IB of protein extracts from WT, ppk18Δ, and igo1Δ strains, grown in rich conditions (R) or starved for 45 min (S). An anti‐tubulin IB is shown as a control for loading.
-
E
P‐Taf12 was followed in WT, igoS64A, pab1Δ, and pab1Δ igoS64A strains, grown in rich conditions (R) or starved for 45 min (S). An anti‐Rpb1 IB is shown as a control for loading.
Data information: In (D and E), the signal intensities of P‐Taf12 and total Taf12 were quantified in each strain and condition. Shown below each blot are average measurements of three independent experiments (
n = 3). A short exposure and a long exposure of the FLAG IB are shown to detect total Taf12 and P‐Taf12, respectively, within the linear range of the chemiluminescence signal. The star (*) symbol labels an unspecific band detected by the FLAG antibody in
S. pombe.

