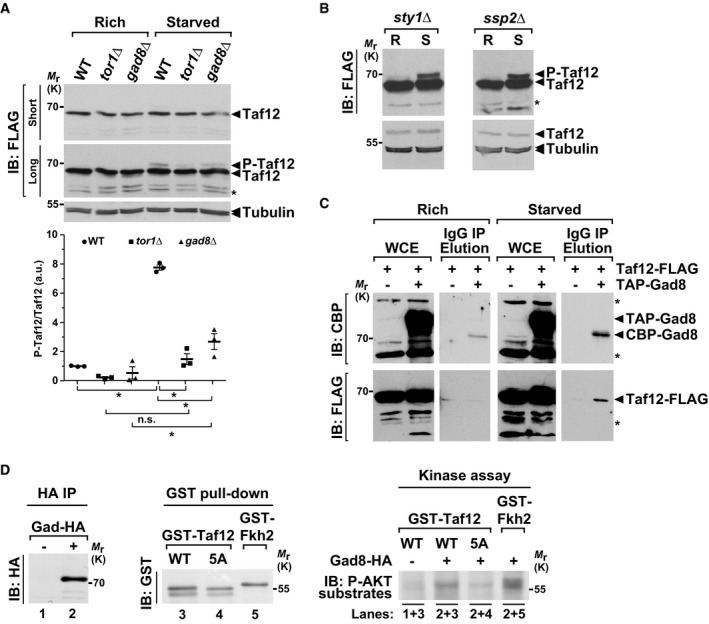
P‐Taf12 was followed by anti‐FLAG IB of protein extracts from WT, tor1Δ, and gad8Δ strains, grown in rich conditions (R) or starved for 45 min (S). An anti‐tubulin IB is shown as a control for loading. The signal intensities of P‐Taf12 and total Taf12 were quantified in each strain and condition. P‐Taf12 to Taf2 ratios were calculated from three independent experiments and individually plotted in a graph below the IBs, together with the mean and SEM. Averaged values from all WT controls grown in rich medium were set at 1 to allow comparisons across culture conditions and mutant strains. Statistical significance was determined by two‐way ANOVA followed by Bonferroni's multiple comparison tests (n = 3); *P ≤ 0.01.
P‐Taf12 was followed by anti‐FLAG IB of protein extracts from sty1Δ cells (left panel) or ssp2Δ cells (right panel), grown in rich conditions (R) or starved for 45 min (S). An anti‐tubulin IB is shown as a control for loading. Shown are IBs that are representative of two independent experiments.
TAP‐tagged Gad8 was immuno‐precipitated using IgG‐Sepharose beads (IP) from strains containing FLAG‐tagged Taf12, grown either in rich medium (left panels) or starved for 45 min (right panels). TAP‐tagged Gad8 was eluted from beads using the TEV protease, releasing a shorter form of Gad8 (CBP‐Gad8). Eluates were loaded and immunoblotted (IB) using anti‐FLAG or anti‐CBP antibodies, together with 1% of whole cell extracts (WCE), to detect Taf12 co‐precipitation with Gad8. A strain which does not contain any TAP tag is shown as a negative control for the IP. Shown is an IB representative of two independent experiments.
Endogenous Gad8‐HA was affinity‐purified from starved cells, in order to activate its kinase activity (left and middle panels), and mixed with recombinant, purified GST‐Taf12, GST‐Taf12‐5A, or GST‐Fkh2 proteins (right panels) in a kinase assay buffer. Each assay was then analyzed by IB and probed with an anti‐phospho‐AKT substrate antibody.
Data information: The star (*) symbols label unspecific bands detected by the FLAG or the CBP antibodies in
.

