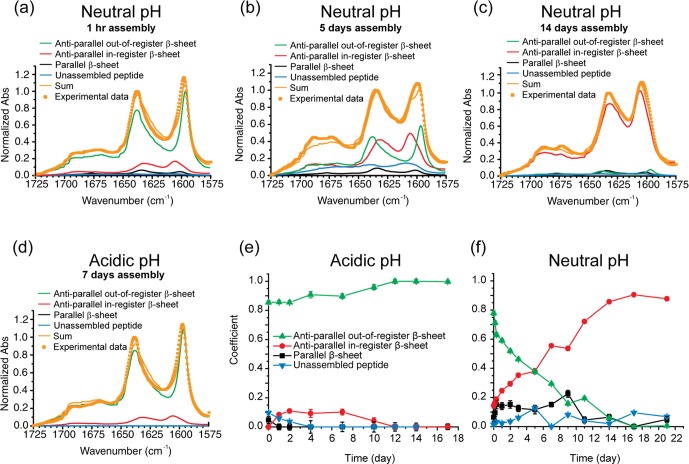
Figure 4.
(a–d) Representative fits of the IR spectra for [1-13C]F19 Aβ(16–22) incubated at (a–c) neutral pH for (a) 1 h, (b) 5 days, and (c) 14 days and (d) at acidic pH for 7 days. Linear combinations of spectra corresponding to mature assemblies with parallel (black), in-register antiparallel (red), and out-of-register antiparallel (green) β-sheets and unassembled peptide (blue) are presented as well as the resulting sums (orange lines), which are compared to the experimental spectra (orange squares). (e, f) IR spectral coefficients derived from fits to the IR spectra of assembled [1-13C]F19 Aβ(16–22) under (e) acidic and (f) neutral pH assembly conditions.

