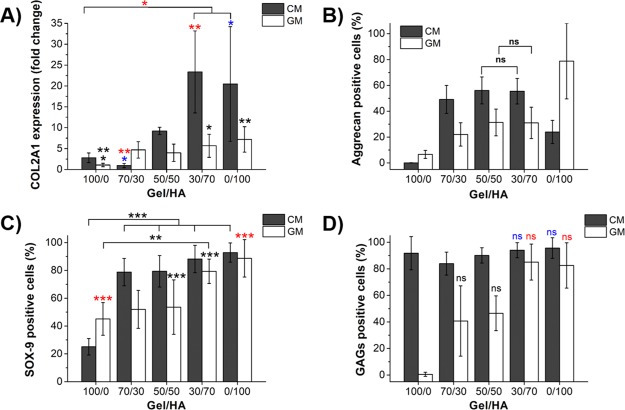
Figure 8.
Quantification of the cell cultures of hMSCs encapsulated in the Gel–HA hydrogels and cultured in the GM and CM for 14 days. (A) Relative collagen type II gene expression from qPCR, represented as a change in the expression relative to Gel in the GM, to which a value of 1 was assigned in the graph. One-way ANOVA with Tukey post-test was performed to find statistical differences; * for p < 0.05, ** for p < 0.01, and *** for p < 0.005. (B) Percentage of positive cells for aggrecan. Mann–Whitney–Wilconson test demonstrated that groups within a type of culture medium show statistically significant differences between each other, except those marked with “ns” (not significant). (C) Percentage of positive cells for SOX-9 obtained from the immunofluorescence images. One-way ANOVA with Tukey post-test was applied for samples cultured in the CM, and Kruskal–Wallis nonparametric test was applied for samples cultured in the CM. * for p < 0.05, ** for p < 0.01, and *** for p < 0.005. (D) Percentage of cells expressing GAGs calculated from alcian blue images. Mann−Whitney−Wilconson test demonstrated that groups within a type of culture medium show statistically significant differences between each other, except those marked with “ns” (not significant).

