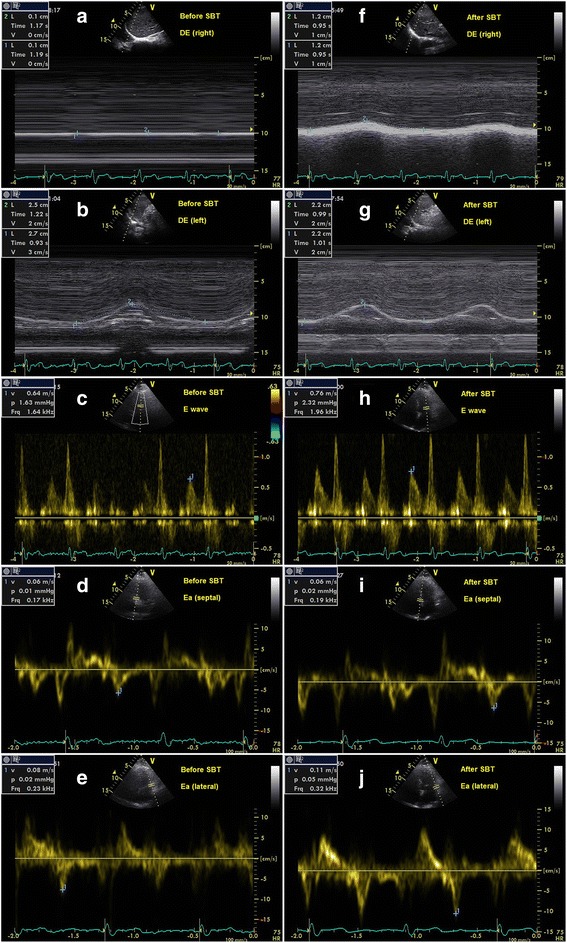
Fig. 3.

The measurements of E/Ea and DE before and after SBT in a patient of extubation success. a, b, c, d, e represented the results before SBT, and f, g, h, i, j represented the results after SBT. a DE (right) was 1 mm. b DE (left) was 26 mm. c E was 64 cm/s. d Ea (septal) was 6 cm/s. e Ea (lateral) was 8 cm/s. f DE (right) was 12 mm. g DE(left) was 22 mm. h E was 76 cm/s. i Ea (septal) was 6 cm/s. j Ea (lateral) was 11 cm/s. Before SBT, DE (average) was 13.5 mm, and E/Ea (average) was 9.1. After SBT, DE (average) was 17 mm, and E/Ea (average) was 8.9. After extubation, the patient did not develop respiratory failure within 48 h. The patient did not require re-intubation within 1 week. DE diaphragmatic excursion, E/Ea the ratio of mitral Doppler inflow velocity (E) to annular tissue Doppler wave velocity (Ea), SBT spontaneous breathing trial
