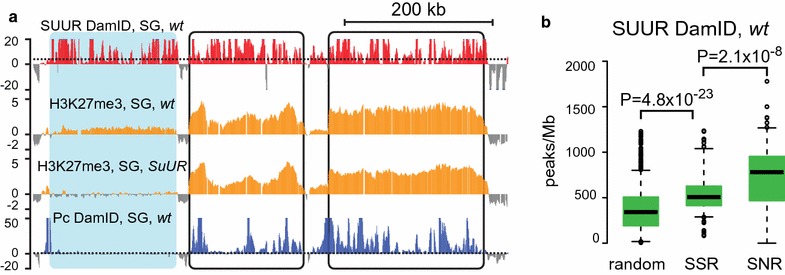
Fig. 4.

Both SSRs and SNRs contain SUUR protein. a DamID profiling detects SUUR protein in SSR (shaded in blue) and in SNRs (black frames). The 600-kb fragment of chromosome 3R is shown. H3K27me3 profiles are presented as quantile normalized log2(IP/inp) values. SUUR and Pc DamID profiles are presented as log10(P) units, where P—significance level assessed with Fisher’s exact test. Dotted lines designate FDR = 0.5 levels for Pc enrichment. b SUUR peak density in SSRs, SNRs and in 1000 random regions across the genome
