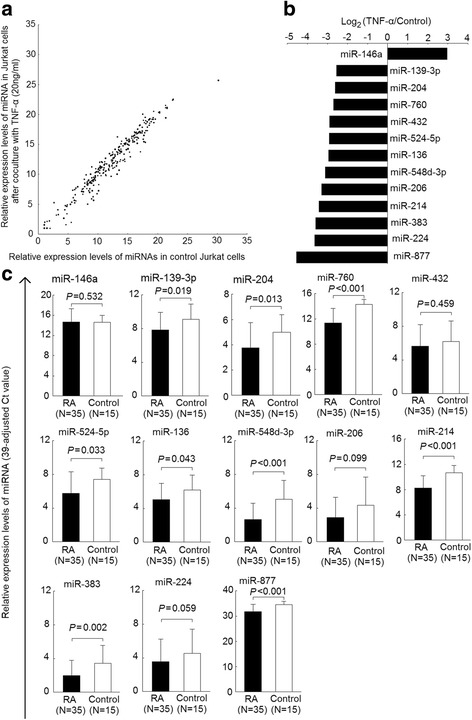
Fig. 1.

Altered expression of T cell miRNAs affected by TNF-α in patients with RA and healthy controls. a Expression profiles of 270 miRNAs in Jurkat cells cultured in the presence or absence of TNF-α (20 ng/mL) for 7 days, as determined by real-time PCR. Each scatter spot representing average normalized expression level of miRNA in three repeats of each treatment; (b) 13 miRNAs exhibiting aberrant expression in Jurkat cells cultured with TNF-α (20 ng/mL) for 7 days; (c) decreased expression of miR-139-3p, miR-204, miR-760, miR-524-5p, miR-136, miR-548d-3p, miR-214, miR-383, and miR-887 in RA T cells miRNA, compared with normal T cells. The relative expression level of miRNA was defined as (39 – Ct) after adjusting with an internal control (U6 small nuclear RNA)
