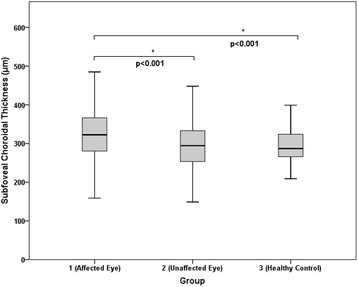
Fig. 2.

Graph showing the difference in subfoveal choroidal thickness. The mean values of subfoveal choroidal thickness in groups 1–3 were 326.7 ± 64.2, 296.1 ± 66.6, and 294.9 ± 41.7 μm, respectively. Relative to groups 2 and 3 (both, P < .001), group 1 exhibited a significantly greater subfoveal choroidal thickness during the acute stage of uveitis. There was no significant difference in subfoveal choroidal thickness between group 2 and 3 (P = .998)
