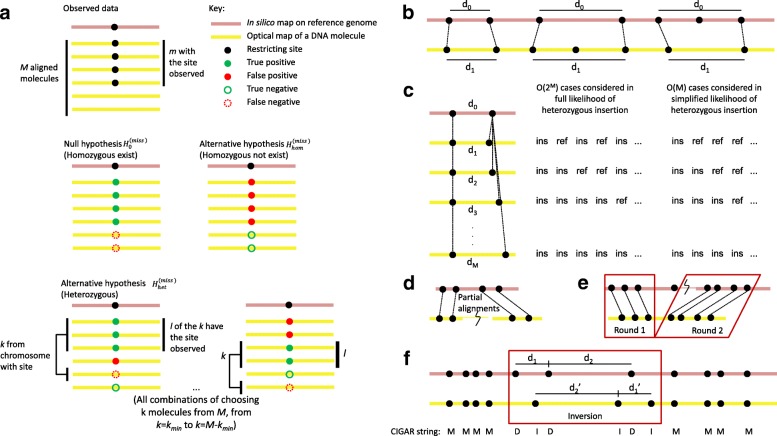
Fig. 2.
Illustration of methods used by OMSV for identifying SVs from optical maps. a The three hypotheses compared in the procedure for detecting missing restriction sites. b Comparing the distance between two restriction sites on the reference and the corresponding observed labels on the optical maps, for detecting large SVs. c Simplification of the likelihood function for the heterozygous insertion hypothesis. In the full likelihood function, each optical map could come from the chromosome with the reference allele (ref) or the insertion allele (ins), and all combinations are considered. In the simplified likelihood function, only the k optical maps with the largest distance between the two nicking site labels are considered to have the insertion, and all values of k are considered. In this illustration, the minimum number of optical maps supporting each allele, k min, is set to 0. d SVs that require partial alignments to identify. e Translocations and large inversions can be identified by two-round split alignments. f Medium-sized inversions are identified by looking for regions with a reverse palindromic CIGAR string (DIDIDI in this example) with matched segment sizes when reversed (d 1 with d1′ and d 2 with d2′ in this example). ins, insertion allele, ref, reference allele, SV, structural variation

