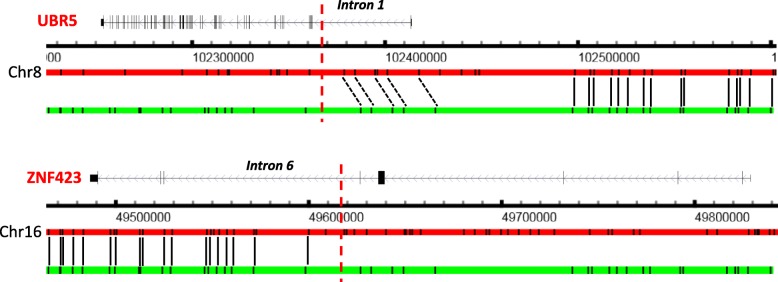
Fig. 5.
The previously reported UBR5–ZNF423 translocation in C666-1 re-identified by OMSV, visualized using the alignment view of OMView. For each of the two gene loci, the top horizontal bar shows the reference and the bottom horizontal bar shows a representative optical map. Black solid and dashed lines linking the reference and the optical map represent, respectively, aligned nicking sites and nicking sites that should probably be aligned but were missed by the alignment pipeline. The vertical red dashed lines show the break points previously reported [36]

