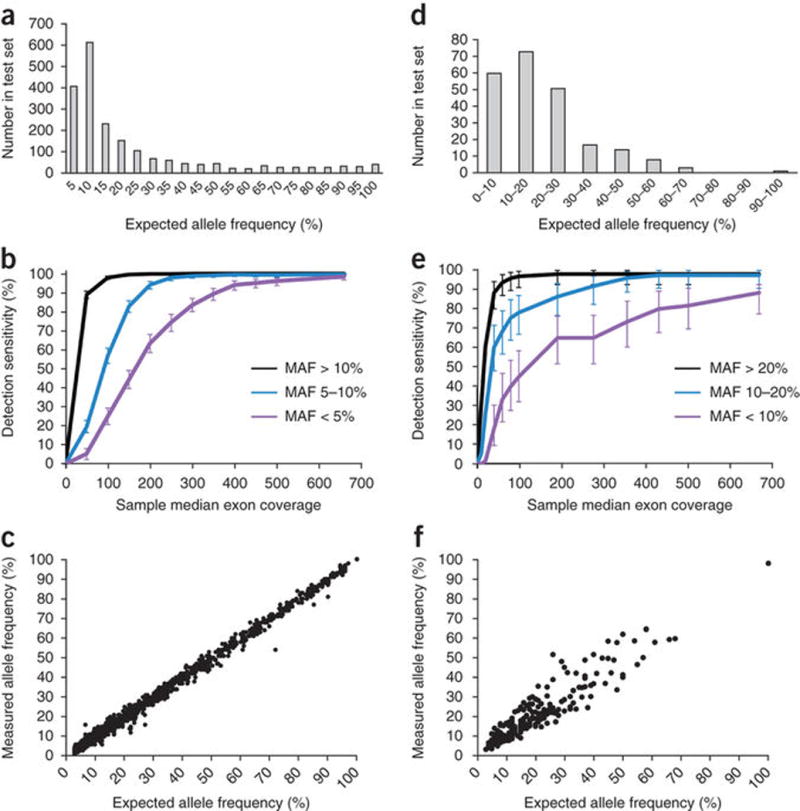
Figure 2.

Base substitution and indel detection performance. (Base substitutions given in panels a–c, indels in panels d–f.) (a) Expected allele frequencies of base substitution alterations within the test set. (b) Detection sensitivity as a function of sample median exon coverage. Error bars, s.e.m. (c) Allele frequencies measured in pooled samples (y axis) match the frequencies expected based on the genotypes and mixing ratios of constituent cell lines (x axis). (d) Expected allele frequencies of indel alterations within the test set. (e) Detection sensitivity as a function of sample median exon coverage. Error bars, s.e.m. (f) Allele frequencies measured in pooled samples (y axis) match the frequencies expected based on the genotypes, ploidy and mixing ratios of constituent cell lines (x axis).
