Figure 3.

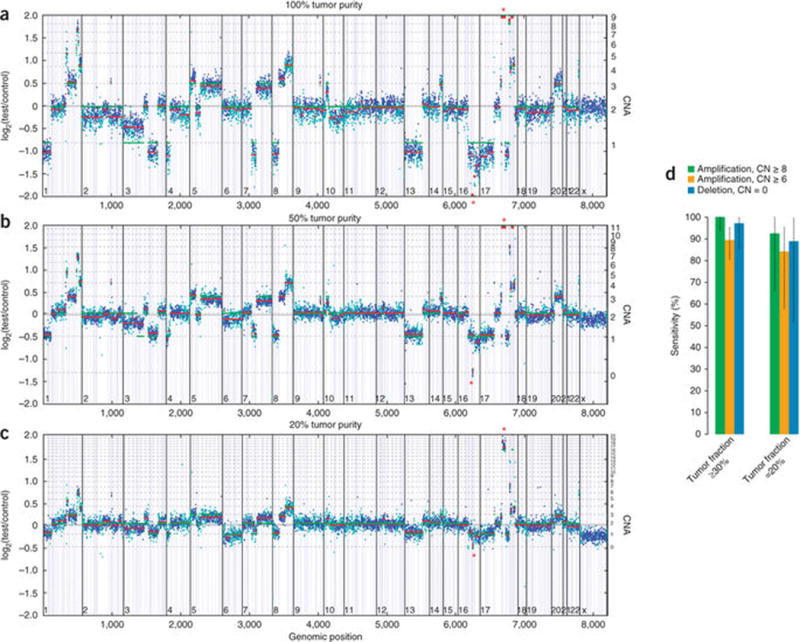
CNA detection performance. (a) Example of CNA data. HCC2218 cell line mixed with matched normal sample at 100% (a), 50% (b) and 20% tumor content (c). Y axes denote log-ratio measurements of coverage obtained in test samples versus a normal reference sample, with assessed copy numbers marked by dashed lines. Each point denotes a genomic region measured by the assay (blue exon, cyan SNP), and these are ordered by genomic position. Red lines indicate average log-ratio in a segment, whereas green lines illustrate the model prediction. Asterisks denote the detected CDH1 homozygous deletion (chr16) and ERBB2 amplification (chr17). (d) Summary of sensitivity results of CNA calling validation study for focal amplifications and homozygous deletions in samples with tumor fractions ≥30% and 20–30%. Error bars, s.e.m.
