
Figure 6.
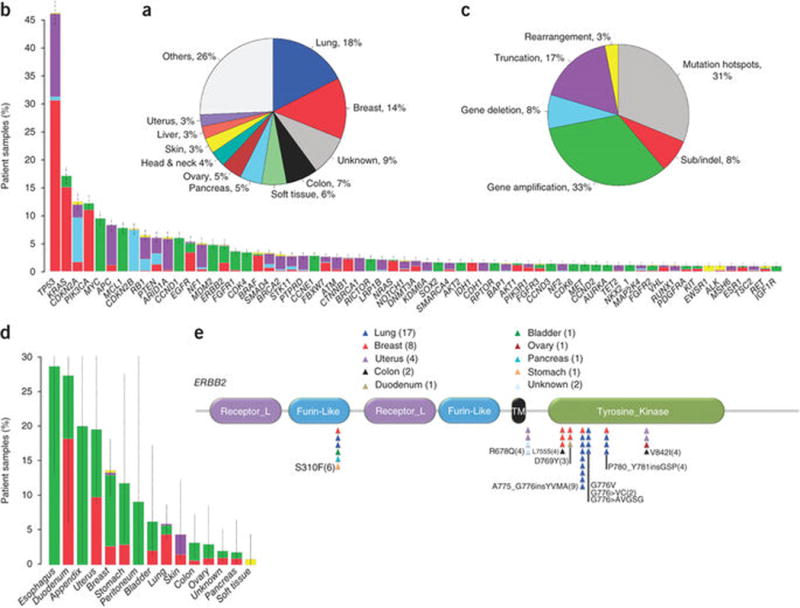
Clinically actionable alterations in patient samples. (a) Distribution of tumor tissue of origin (type) for profiled specimens. (b) Frequency of all reported alterations in most commonly altered genes among the specimens. Alterations are colored according to alteration class, as depicted in panel c. Error bars, s.e.m. (c) Distribution of clinically actionable alteration classes detected. (d) Frequency of ERBB2 alterations detected among specimens of various tumor types. Alterations are colored according to class, as in panel c. Error bars, s.e.m. (e) Distribution of substitution and indel mutations, across the domain structure of the ERBB2 protein. Individual mutations are represented as triangles colored according to the tumor type.