Fig. 5.

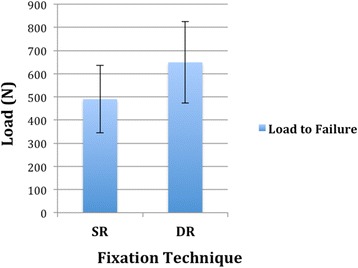
Load to failure: Comparison of ultimate failure loads for single and double row fixation of greater tuberosity fractures (p = .12). Data are presented as mean and standard deviation (N)

Load to failure: Comparison of ultimate failure loads for single and double row fixation of greater tuberosity fractures (p = .12). Data are presented as mean and standard deviation (N)