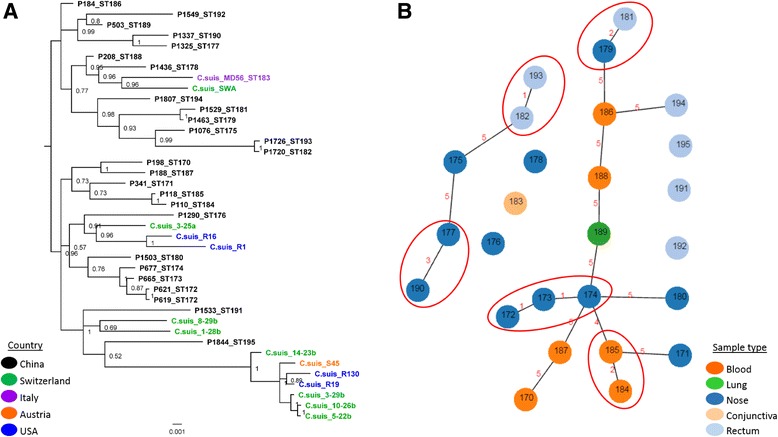
Fig. 4.

Phylogenetic and cluster analyses of C. suis STs. a: Bayesian phylogenetic analysis of the concatenated sequences of seven MLST fragments of 40 C. suis strains. Posterior probabilities are displayed on tree nodes, while the geographical origin of the strain is indicated by different colors as outlined in the legend; b: Cluster analyses of C. suis STs, N locus difference is indicated on the link between the nodes. Clonal complexes are circled in red. Sample types from which the C. suis STs were derived are indicated by the colors, as outlined in the legend.
