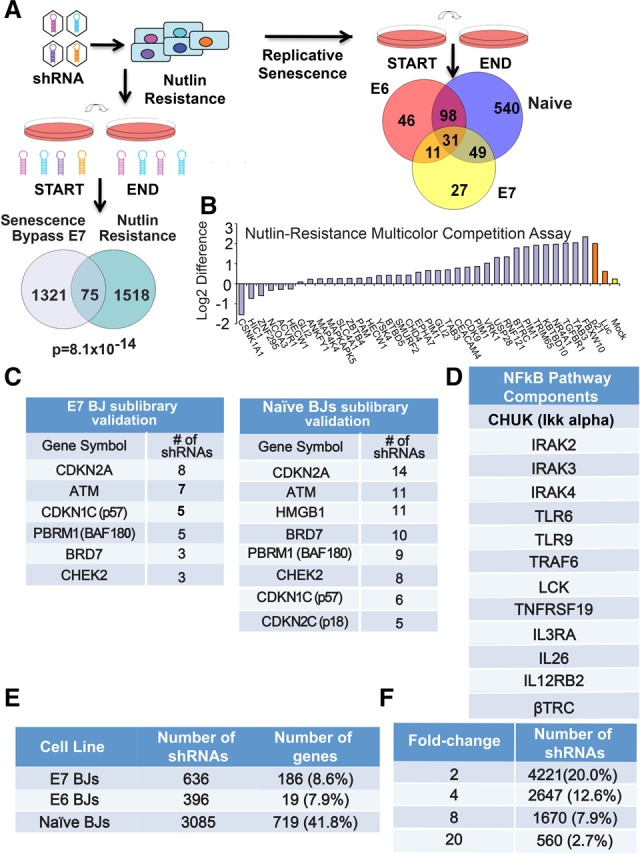
Figure 1.

Loss-of-function screens identify high-confidence candidate genes. (A) Schematic showing screen design and library pool deconvolution for the senescence bypass and nutlin resistance screens. (Bottom left) Venn diagram showing the overlap between the senescence bypass screen candidate gene list in E7 BJ fibroblasts and the nutlin resistance screen performed in human mammary epithelial cells (HMECs) for the genome-scale library. The probability of overlap was calculated by hypergeometric probability distribution. (Right) Venn diagram showing the gene overlap between the senescence resistance validation screens in E6, E7, and naïve BJs. The numbers shown refer to the number of genes that were enriched twofold or greater and targeted by three or more shRNAs. (B) Representative validation data from nutlin resistance screens as shown by multicolor competition assays in HMECs in the presence or absence of nutlin-3a for three PDs. Cells expressing either Luc shRNA or mock-infected served as negative controls in HMECs expressing GFP (green fluorescent protein). Cells expressing shRNAs against p21 served as positive controls. Data are plotted as the difference between the log2 ratios of untreated and nutlin-treated cells. (C) Validation rescreen data indicating the number of selected shRNAs that scored to twofold or greater above the average of 100 negative control shRNAs for the indicated subset of genes for the sublibrary validation screen in E7 BJ fibroblasts (left) and naïve BJs (right). (D) Components of the NFκB pathway that scored in our screens in E6 BJ fibroblasts. (E) Table showing the number of selected shRNAs that scored twofold or greater with three or more shRNAs. (F) Table showing the number of shRNAs that scored above each threshold relative to the average of the negative control shRNAs in the validation screen performed in naïve BJ fibroblasts.
