Figure 2.
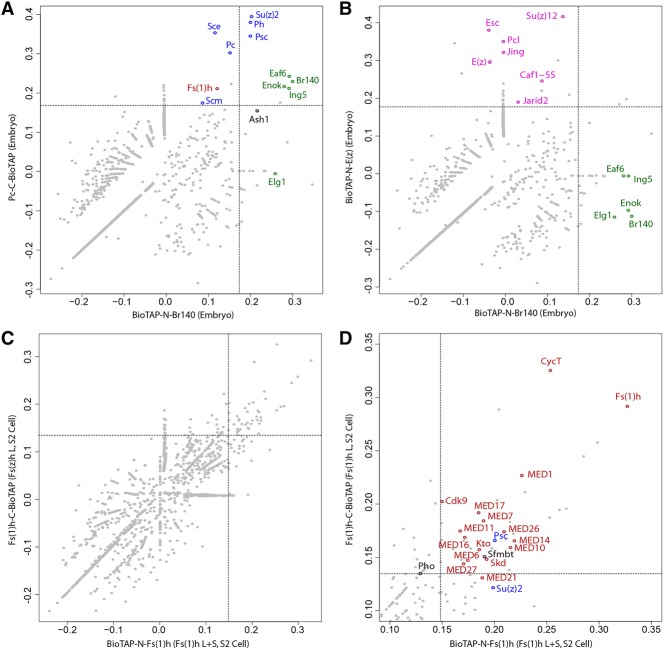
Proteomic analysis of Br140 and Fs(1)h complexes. (A,B) Scatter plots of Br140 and Pc (A) or E(z) (B) pull-down enrichment over total embryonic chromatin proteins. Each point represents an individual protein, with coordinates corresponding to its log enrichment in Br140 pull-downs (X-axis) and Pc (A) or E(z) (B) pull-downs (Y-axis). Dashed lines represent the 99th percentile of Br140 enrichment (vertical line) and Pc (A) or E(z) (B) enrichment (horizontal line). PRC1 (A) and PRC2 (B) components are highlighted in blue and pink, respectively. Known dMOZ/MORF components are highlighted in green. (C) Scatter plot showing Fs(1)h enrichment over total S2 cell chromatin input. Each point represents an individual protein, with coordinates corresponding to its enrichment in BioTAP-N Fs(1)h pull-downs (X-axis) and Fs(1)h C-BioTAP pull-downs (Y-axis). “L + S” indicates that both long and short Fs(1)h isoforms carried the BioTAP tag, while “L” indicates that only the long Fs(1)h isoform was tagged. Dashed lines represent the 98th percentile of BioTAP-N Fs(1)h enrichment (vertical line) and Fs(1)h C-BioTAP enrichment (horizontal line). See Supplemental Data File S1 for full results. (D) The zoomed-in view of the top right quadrant of the scatter plot in C shows selected protein identities above the 98th percentile. Mediator and P-TEFb complex proteins are highlighted in red, and PcG proteins are highlighted in blue.

