Figure 4.
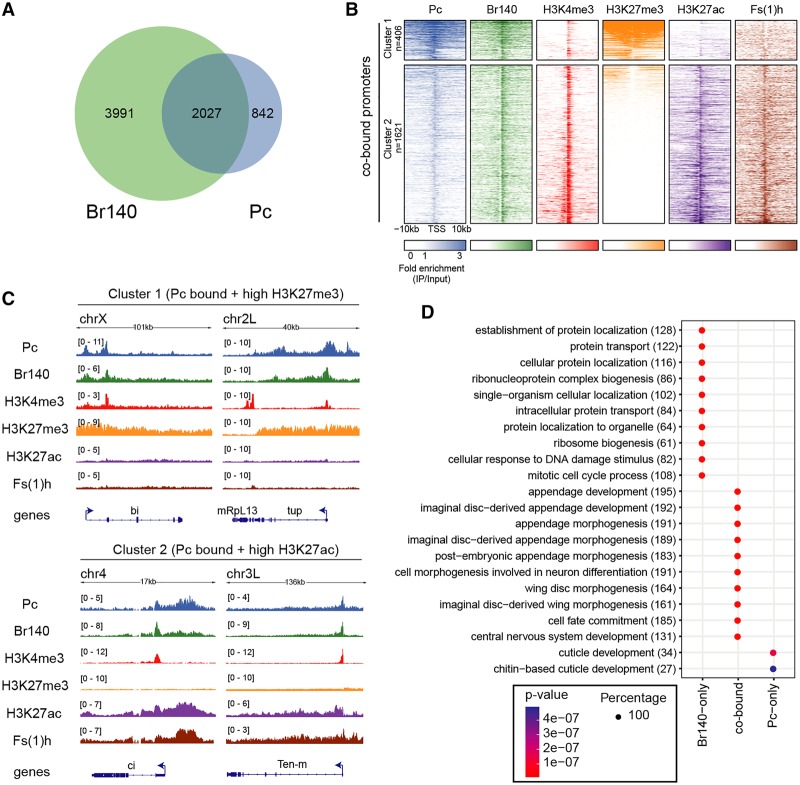
Co-occupancy of Pc and Br140 in embryos. (A) Venn diagram of the overlap between Pc- and Br140-bound genes in embryos. (B) Heat maps of embryo ChIP-seq enrichment patterns of BioTAP-tagged Pc, Br140, Fs(1)h, and indicated histone H3 modifications within ±10 kb of TSSs of genes cobound by Pc and Br140. Heat maps are centered at TSSs and ordered by H3K27me3 intensity. Signals were clustered into two groups by k-means clustering based on the distributions of the proteins and histone modifications surrounding the cobound promoters. (C) Genome browser views from embryo ChIP-seq data showing binding profiles of the indicated proteins in representative regions with high H3K27me3 and low H3K27ac (cluster 1; top) or low H3K27me3 and high H3K27ac (cluster 2; bottom). (D) Gene ontology (GO) term enrichment for genes with promoters cobound by Br140 + Pc or bound only by Br140 or Pc as indicated. The numbers in parentheses indicate the number of genes from our data sets that corresponded to each category. The size of each dot indicates that each GO term was found exclusively (100%) with only one of the three sets of genes (Rb140 only, cobound, or Pc only) rather than divided between them.

