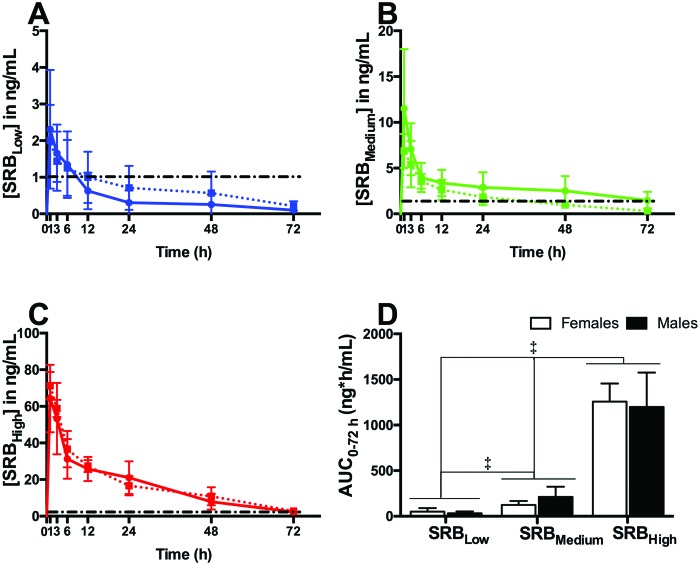
Figure 5.
Pharmacokinetics of 3 concentrations of SRB in healthy guinea pigs (females, dotted lines; males, solid lines). In A through C, black dashed lines represent target therapeutic levels (1 ng/mL). Overall plasma concentrations are expressed as AUC0-72 h. (D) AUC0-72 h of the SRBHigh group was greater than those for SRBMedium and SRBLow. ‡, P < 0.001 (one-way ANOVA).

