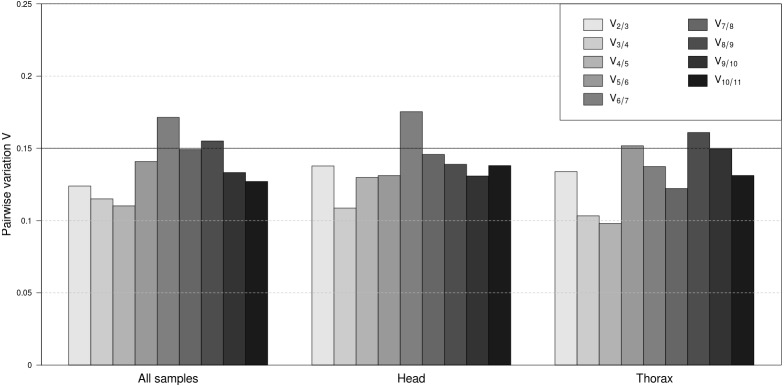
Figure 2. Pairwise variation analyses by geNorm to determine the optimal number of reference genes for accurate normalization.
Pairwise variation for all samples together, as well as separately for head and thorax samples. The lowest number of genes with Vn∕n+1 less than 0.15 means the optimum number of genes.

