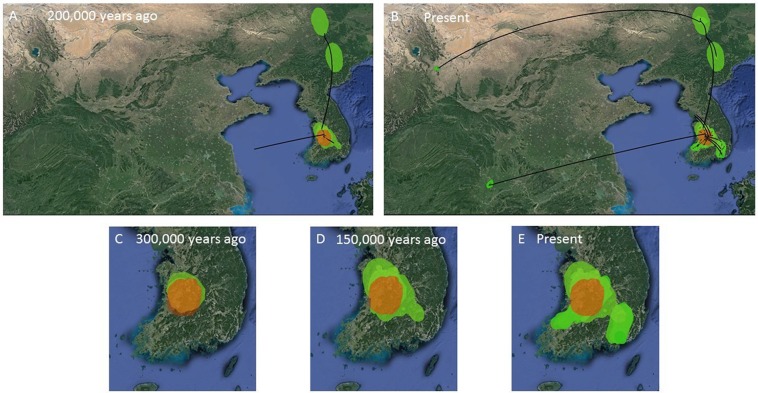
Figure 7. MCC Bayesian phylogeographic projections for Bufo gargarizans at different times scales.
(A, B) Mainland expansions 200 K. y. a. and present, (C–E) Korean Peninsula expansions 300 K, 150 K. y. a., and present. The MCC gene tree is represented with black lines. Old diffusions shown in orange and more recent ones are shown in light green. Map data ©2015 Google.

