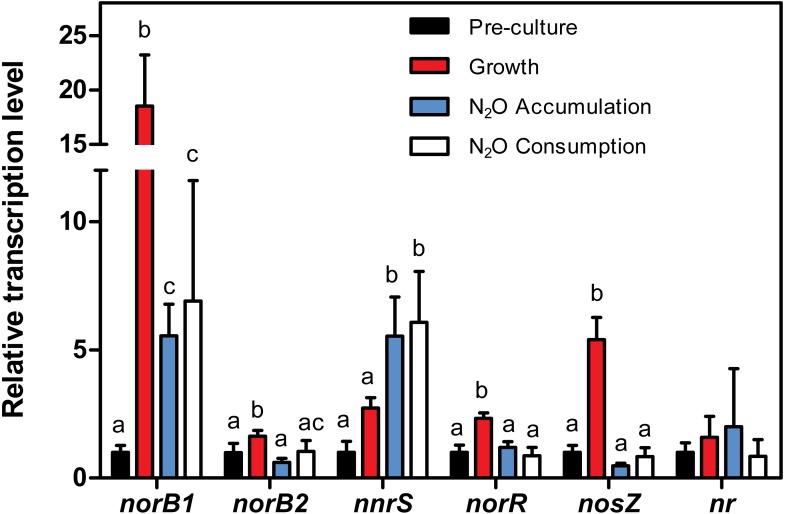
Figure 6. Relative transcript levels of cnorB1, cnorB2, nnrS, nosZ, norR and the assimilatory nitrate reductase (nr).
Strain JAM1 was cultured under anoxic conditions in NH4Cl-free 1403 medium with 22 mg-N vial. Growth patterns were similar to those shown in Fig. 1B under the same conditions with regular 1403 medium. Samples were drawn from the pre-cultures (2–3 day old oxic cultures with no ) and during the growth phase ( reduction), N2O accumulation phase, and N2O consumption phase (see Fig. 4A), from which total RNA was extracted for RT-qPCR assays. Changes in the levels of cnorB1, cnorB2, nnrS, nosZ, norR and nr transcripts were calculated relative to their expression during the pre-culture phase (set to one, black column). One-way ANOVA tests with Tukey post hoc tests were performed within each phase. Columns represented by different letters are significantly different (P < 0.05). Data represent mean values ± SD.

