
Fig. 1. Humeral and tibial CSG properties among the prehistoric and modern groups.
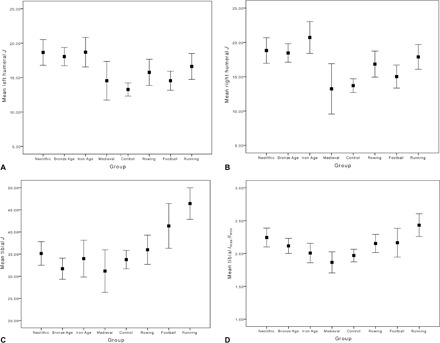
(A) Polar second moment of area (J), left humerus, 35% section location (n = 157). (B) Polar second moment of area (J), right humerus, 35% section location (n = 151). (C) Polar second moment of area (J), tibia, 50% section location (n = 173). (D) Imax/Imin, tibia, 50% section location (n = 178). Data are given as means ± 95% confidence interval (CI). Summary statistics by group are given in Table 1, and means were compared using one-way ANOVA.