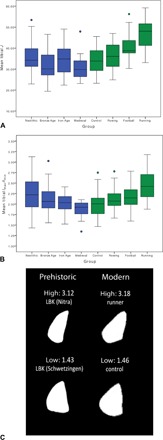
Fig. 2. Variation in tibial J and Imax/Imin among prehistoric and living women.

(A) Box plot of midshaft tibial J values showing the median, upper and lower quartiles, and interquartile range by group (n = 173). (B) Box plot of midshaft tibial Imax/Imin values showing the median, upper and lower quartiles, and interquartile range by group (n = 178). (C) Midshaft tibial solid-section images showing the variation in Imax/Imin values among Early Neolithic LBK women and living women. Summary statistics by group are given in Table 1.
