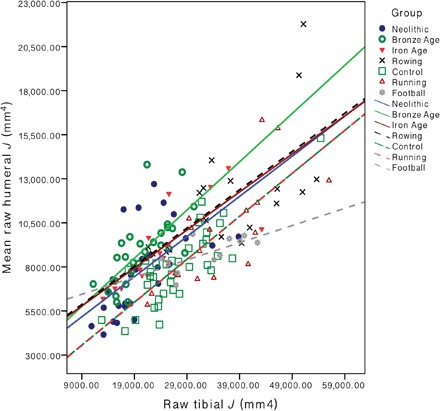
Fig. 4. Interlimb strength proportions among prehistoric and agricultural women by group.

Scatterplot of humeral versus tibial raw polar second moments of area (J; mm4) among prehistoric agricultural women and living women by time period and sport (n = 159). Solid lines of best fit represent prehistoric populations, and dashed lines of best fit represent living groups.
