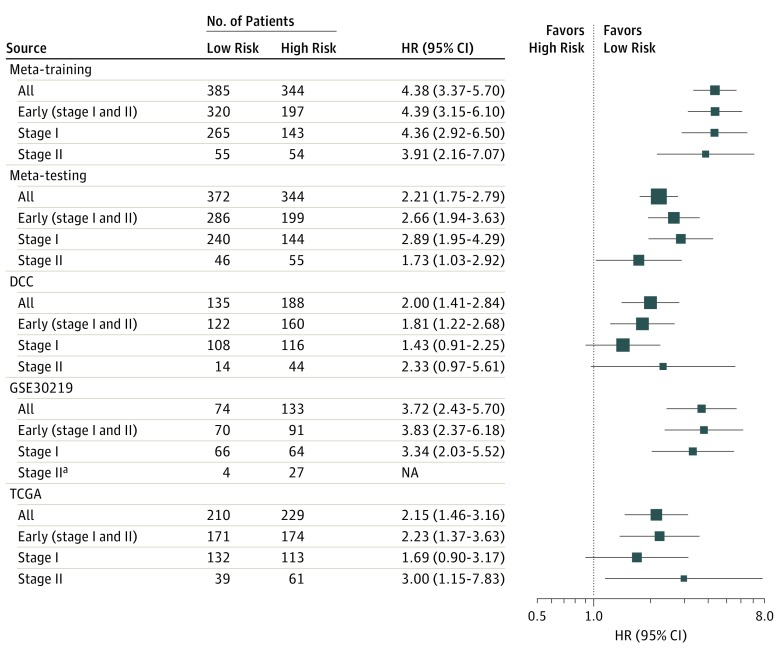
Figure 2. Forest Plot for the Hazard Ratios (HRs) of High vs Low Immune-Related Gene Pair Index (IRGPI) Risk Groups.
Univariate Cox proportional hazards regression was applied to estimate HRs between IRGPI high and low risk in each data set within stage subgroups. Early represents patients with stage I and stage II nonsquamous non–small-cell lung cancer (NSCLC). The length of horizontal line corresponds to the confidence interval, and the size of the HR data marker is inversely proportional to the confidence interval. Vertical dotted line indicates HR of 1.0. DCC indicates Director’s Challenge Consortium; NA, not applicable; TCGA, The Cancer Genome Atlas.
aHazard ratio is not reported because of unstable estimation of Cox proportional hazards regression model.

