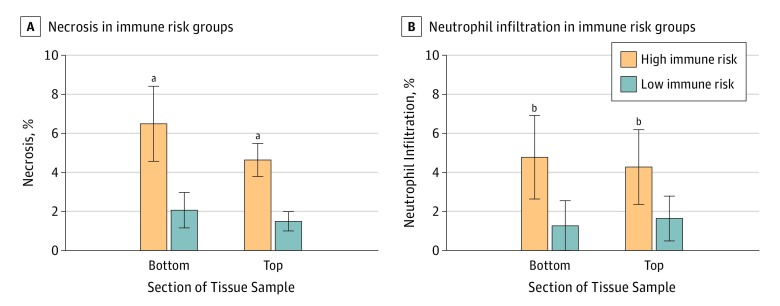
Figure 3. Immune Infiltration Status of Immune-Related Gene Pair Index (IRGPI) Risk Groups in The Cancer Genome Atlas (TCGA) Data Set.
Groups are stratified by low and high risk. Data from top and bottom sections of snap-frozen tissue samples are given. Error bars indicate estimated 95% CI.
aP < .001, compared with the low immune risk group, by Wilcoxon rank sum test.
bP < .005, compared with the low immune risk group, by Wilcoxon rank sum test.

