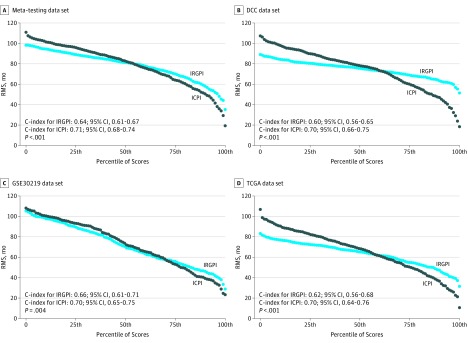
Figure 4. Restricted Mean Survival (RMS) Curves for Continuous Signature Values in Validation Cohorts.
The RMS curve for immune-related gene pair index (IRGPI) and immune-clinical prognostic index (ICPI) scores was plotted for (A) meta-testing, (B) Director’s Challenge Consortium (DCC), (C) Gene Expression Omnibus (GSE30219), and (D) The Cancer Genome Atlas (TCGA) data sets. Each point represents the RMS time of corresponding IRGPI and ICPI scores. The RMS curves showed a larger slope in all data sets for ICPI, indicating the superior estimation of survival with ICPI. Concordance index (C-index) for IRGPI and ICPI was also provided. P value represents the difference between IRGPI and ICPI in terms of C-index.

