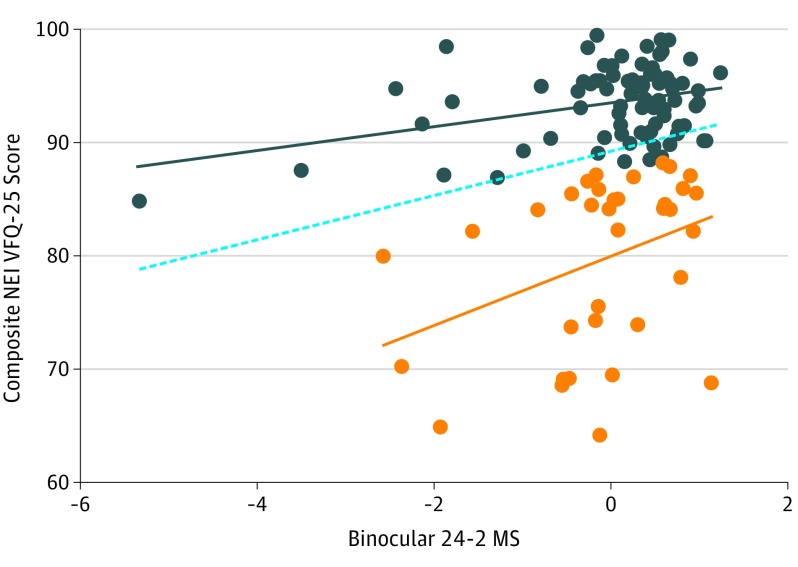
Figure. Scatterplot of Rasch-Adjusted National Eye Institute Visual Function Questionnaire (NEI VFQ-25) Scores vs Standardized Binocular 24-2 Mean Sensitivity (MS).
Outliers with disproportionately poor scores relative to the 24-2 are shown in orange. The remainder of the patients are seen in blue. Best-fitting lines are shown for the outliers (orange line), the rest of the patients (blue line), and the entire sample (dotted line).

