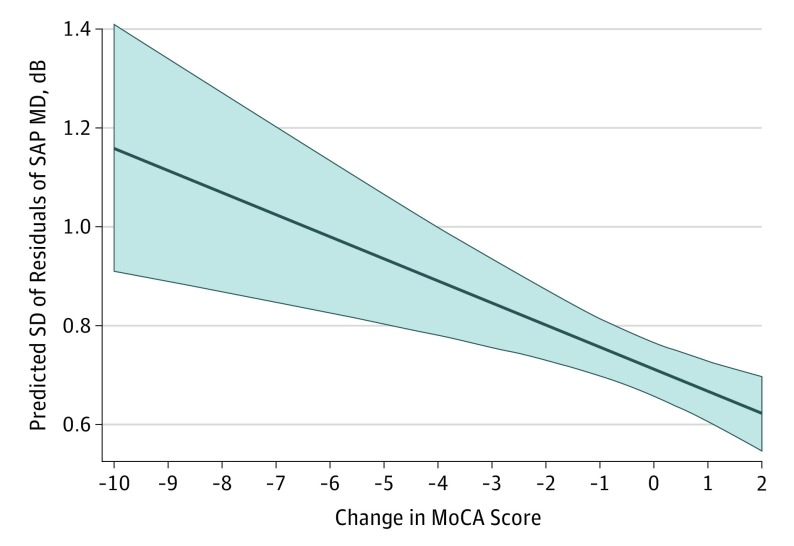
Figure 3. Predicted Values of Visual Field Variability for Different Amounts of Cognitive Change.
Predicted values and 95% CIs (shaded region) of the SD of residuals of standard automated perimetry (SAP) mean deviation (MD) for different amounts of change in Montreal Cognitive Assessment (MoCA) score. Predictive values and 95% CIs are adjusted for age, sex, race/ethnicity, disease severity, number of visual field tests over time, baseline MoCA score, and income and educational levels.

